Ethereum price is about to break out as it slowly forms a bullish flag pattern, and as spot ETH ETFs face substantial inflows. The ETH token was trading at $2,535 on Saturday, a range it has maintained for the past two weeks.
Data shows that demand for Ethereum ETFs is rising. According to SoSoValue, all ETH ETFs have accumulated over $3 billion in inflows since their inception in September last year.
They added $70 billion in assets on Friday, marking the tenth consecutive day that they had inflows. BlackRock’s ETHA continues to lead in assets with over $3.6 billion, followed by Grayscale’s ETHE and ETH, which have $2.92 billion and $1.29 billion in assets.
READ MORE: LINK Price Crashes as Chainlink Whales Dump, Exchange Reserves Dip
The ongoing Ethereum ETFs explain why Ethereum has done better than other cryptocurrencies in the past few days. Solana has plunged by 16% from its highest point in May, while Sui has retreated by over 23%.
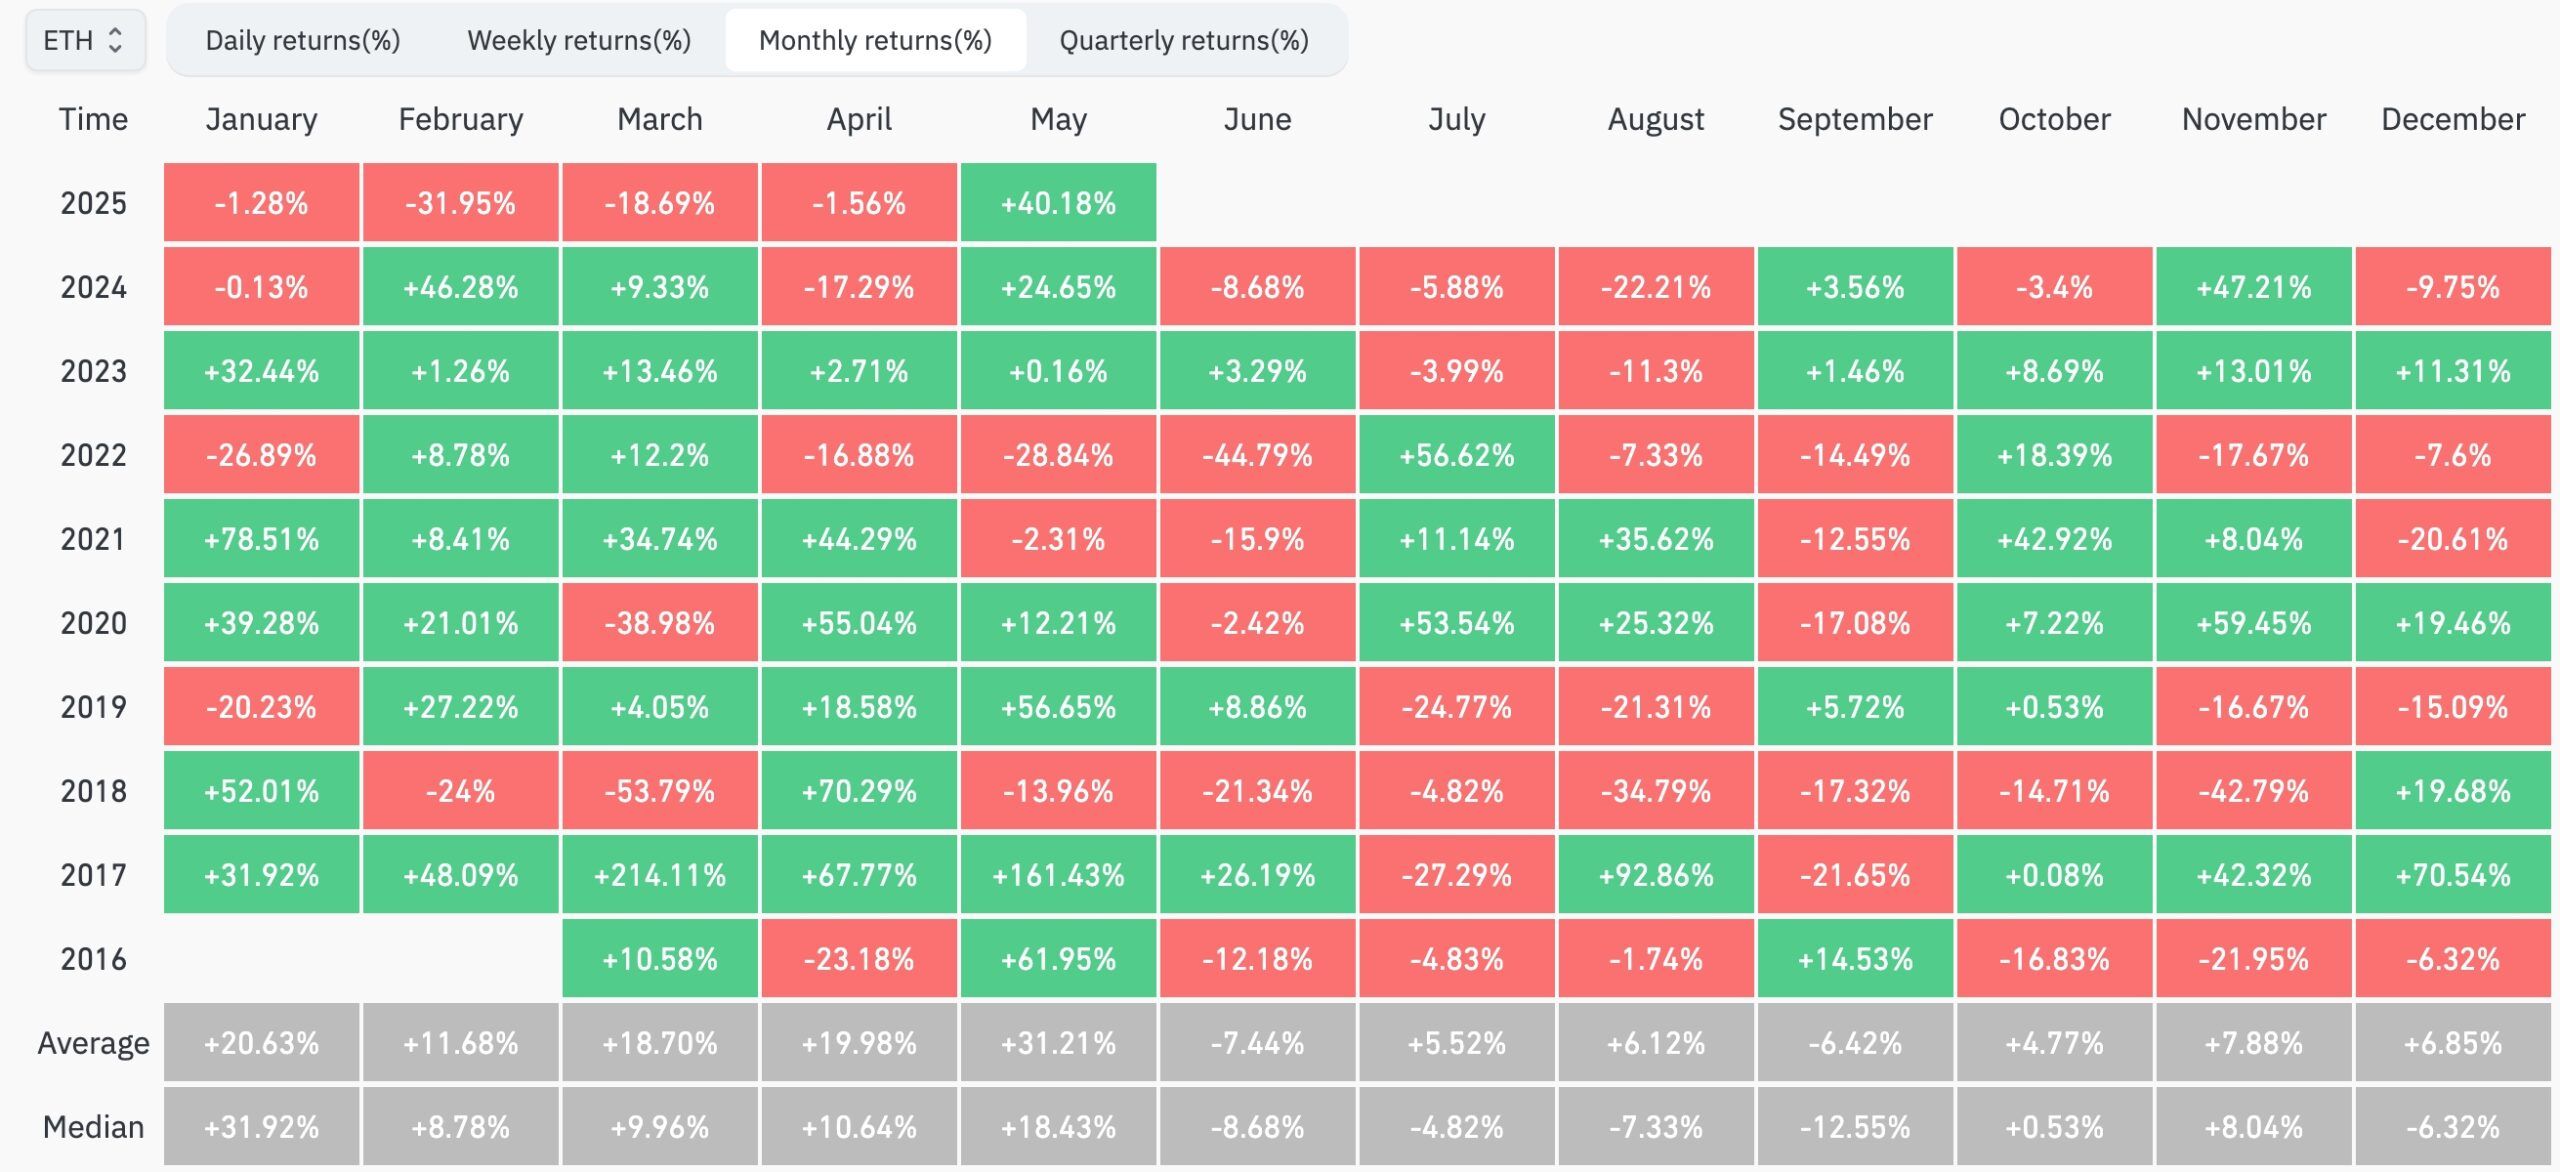
The risk that Ethereum faces is that June is normally its worst month of the year. It has dropped in June of most years, meaning that the trend may continue this year. Fortunately, CoinGlass data show that it has bucked this trend several times this year.

Ethereum Price Technical Analysis

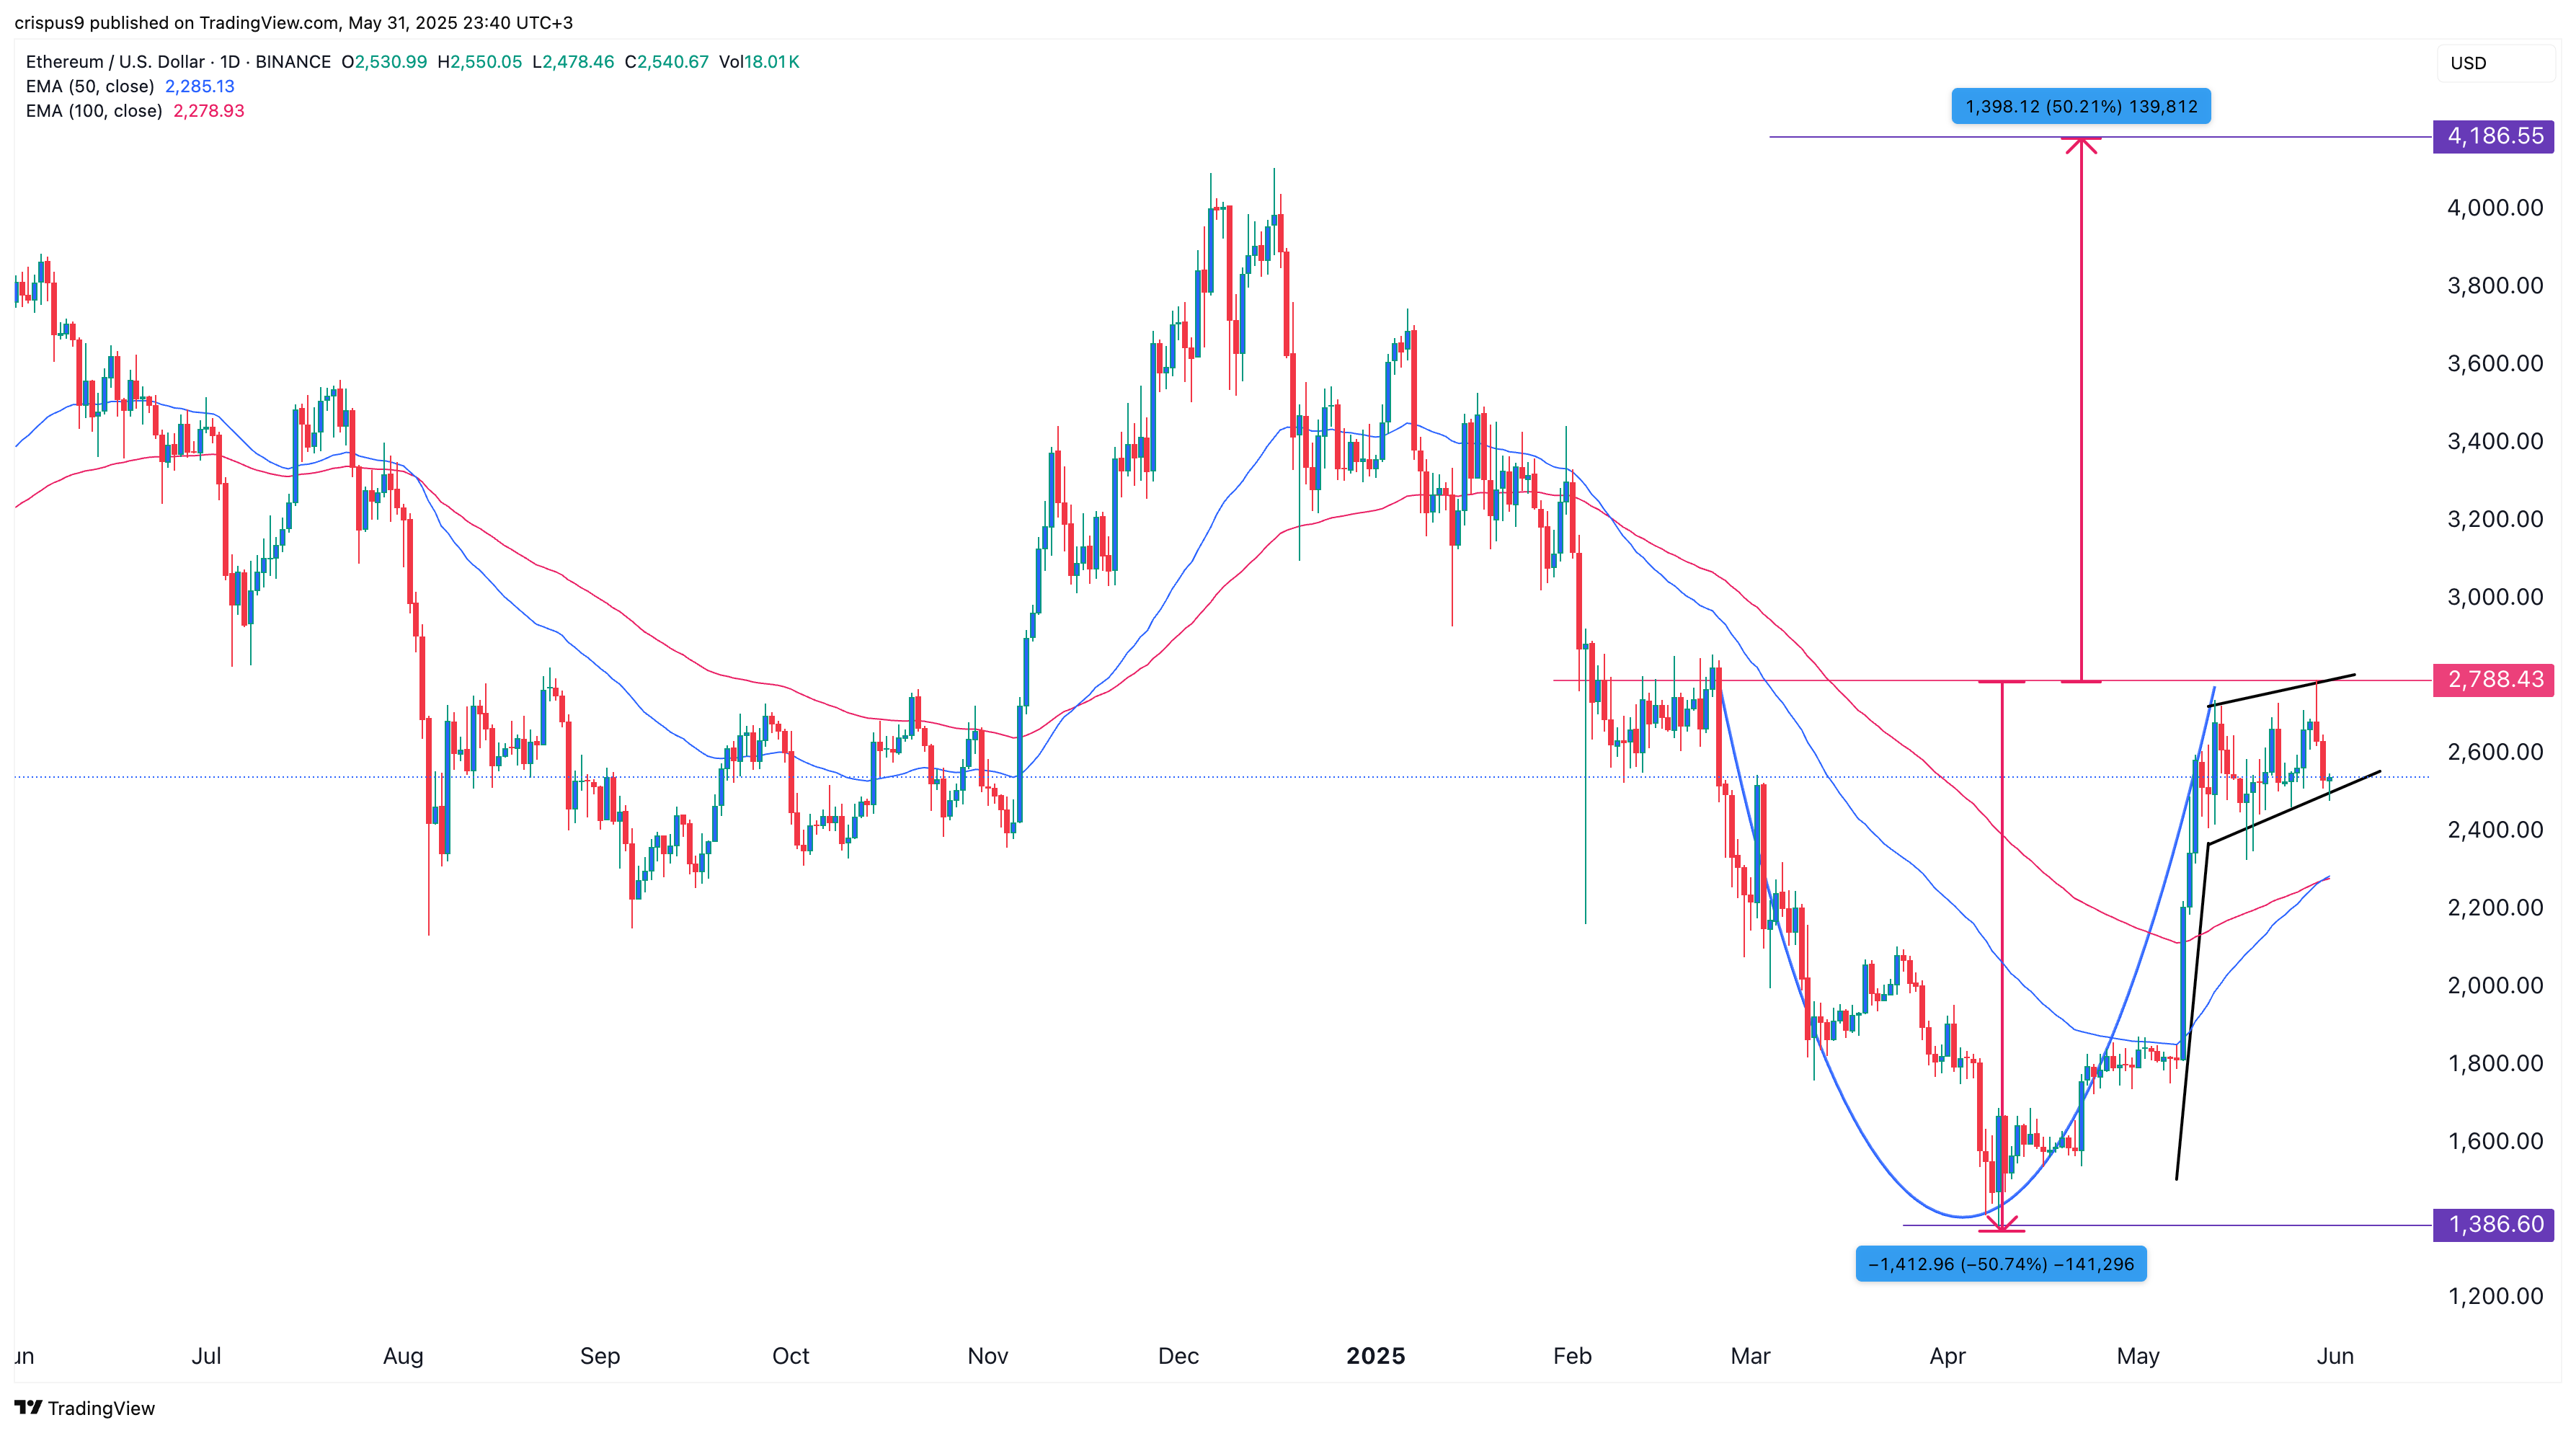
The daily chart indicates that the ETH price has formed several patterns that may propel it higher in the long term. First, it has formed a cup-and-handle pattern whose upper side is at $2,788. A C&H is one of the most popular bullish continuation signs in technical analysis.
Second, the coin has formed a bullish flag pattern, comprising a vertical line and a rectangle. This rectangle is part of the cup-and-handle pattern.
Furthermore, the ETH price has formed a mini golden cross pattern, as the 50-day and 100-day Exponential Moving Averages (EMAs) have crossed each other. Therefore, the most likely scenario is one where the ETH price continues to rise, with the next target being $3,000, followed by the psychological level of $4,000.
READ MORE: Here’s Why Pocket Network (POKT), Livepeer (LPT), Moonwell are Surging


