


Binance Coin plunged to a low of $610, its lowest level since May 8, and over 13.32% from its highest point this month. BNB price has plunged by over 23% from the year-to-date high. This plunge has happened despite the booming BSC stablecoin ecosystem.
BNB Price Crashes Despite Stablecoin Growth
Binance Coin has been in a strong bearish trend in the past few days as the network has boomed. Artemis data shows that the total stablecoin transactions on the BSC Chain have grown by over 8% in the last 30 days to over $749 billion.
The adjusted transaction volume, which excludes MEV and intra-exchange volume, rose by over 27% in the last 30 days to over $335 billion. This makes BNB one of the biggest chains for stablecoin transactions in the crypto industry.
READ MORE: Axelar Price Prediction: Here’s Why AXL Token May Rebound
More data shows that the number of stablecoin transactions has jumped by almost 20% in the last 30 days to 576 million. The supply of stablecoins in the network has risen by 3.4% to $10.5 billion, while the stablecoin addresses soared by 168% to 11.5 million.
Most of the ongoing growth happened because of Donald Trump’s USD1 stablecoin. The top stablecoins on the network are Tether (USDT), USD Coin (USDC), and USDX.
More data shows that BSC has become the biggest chain in decentralized exchanges (DEX). Its network, led by PancakeSwap, handled over $159 billion in the last 30 days, surpassing the combined totals of Solana, Ethereum, and Base.
Binance Coin Price Technical Analysis
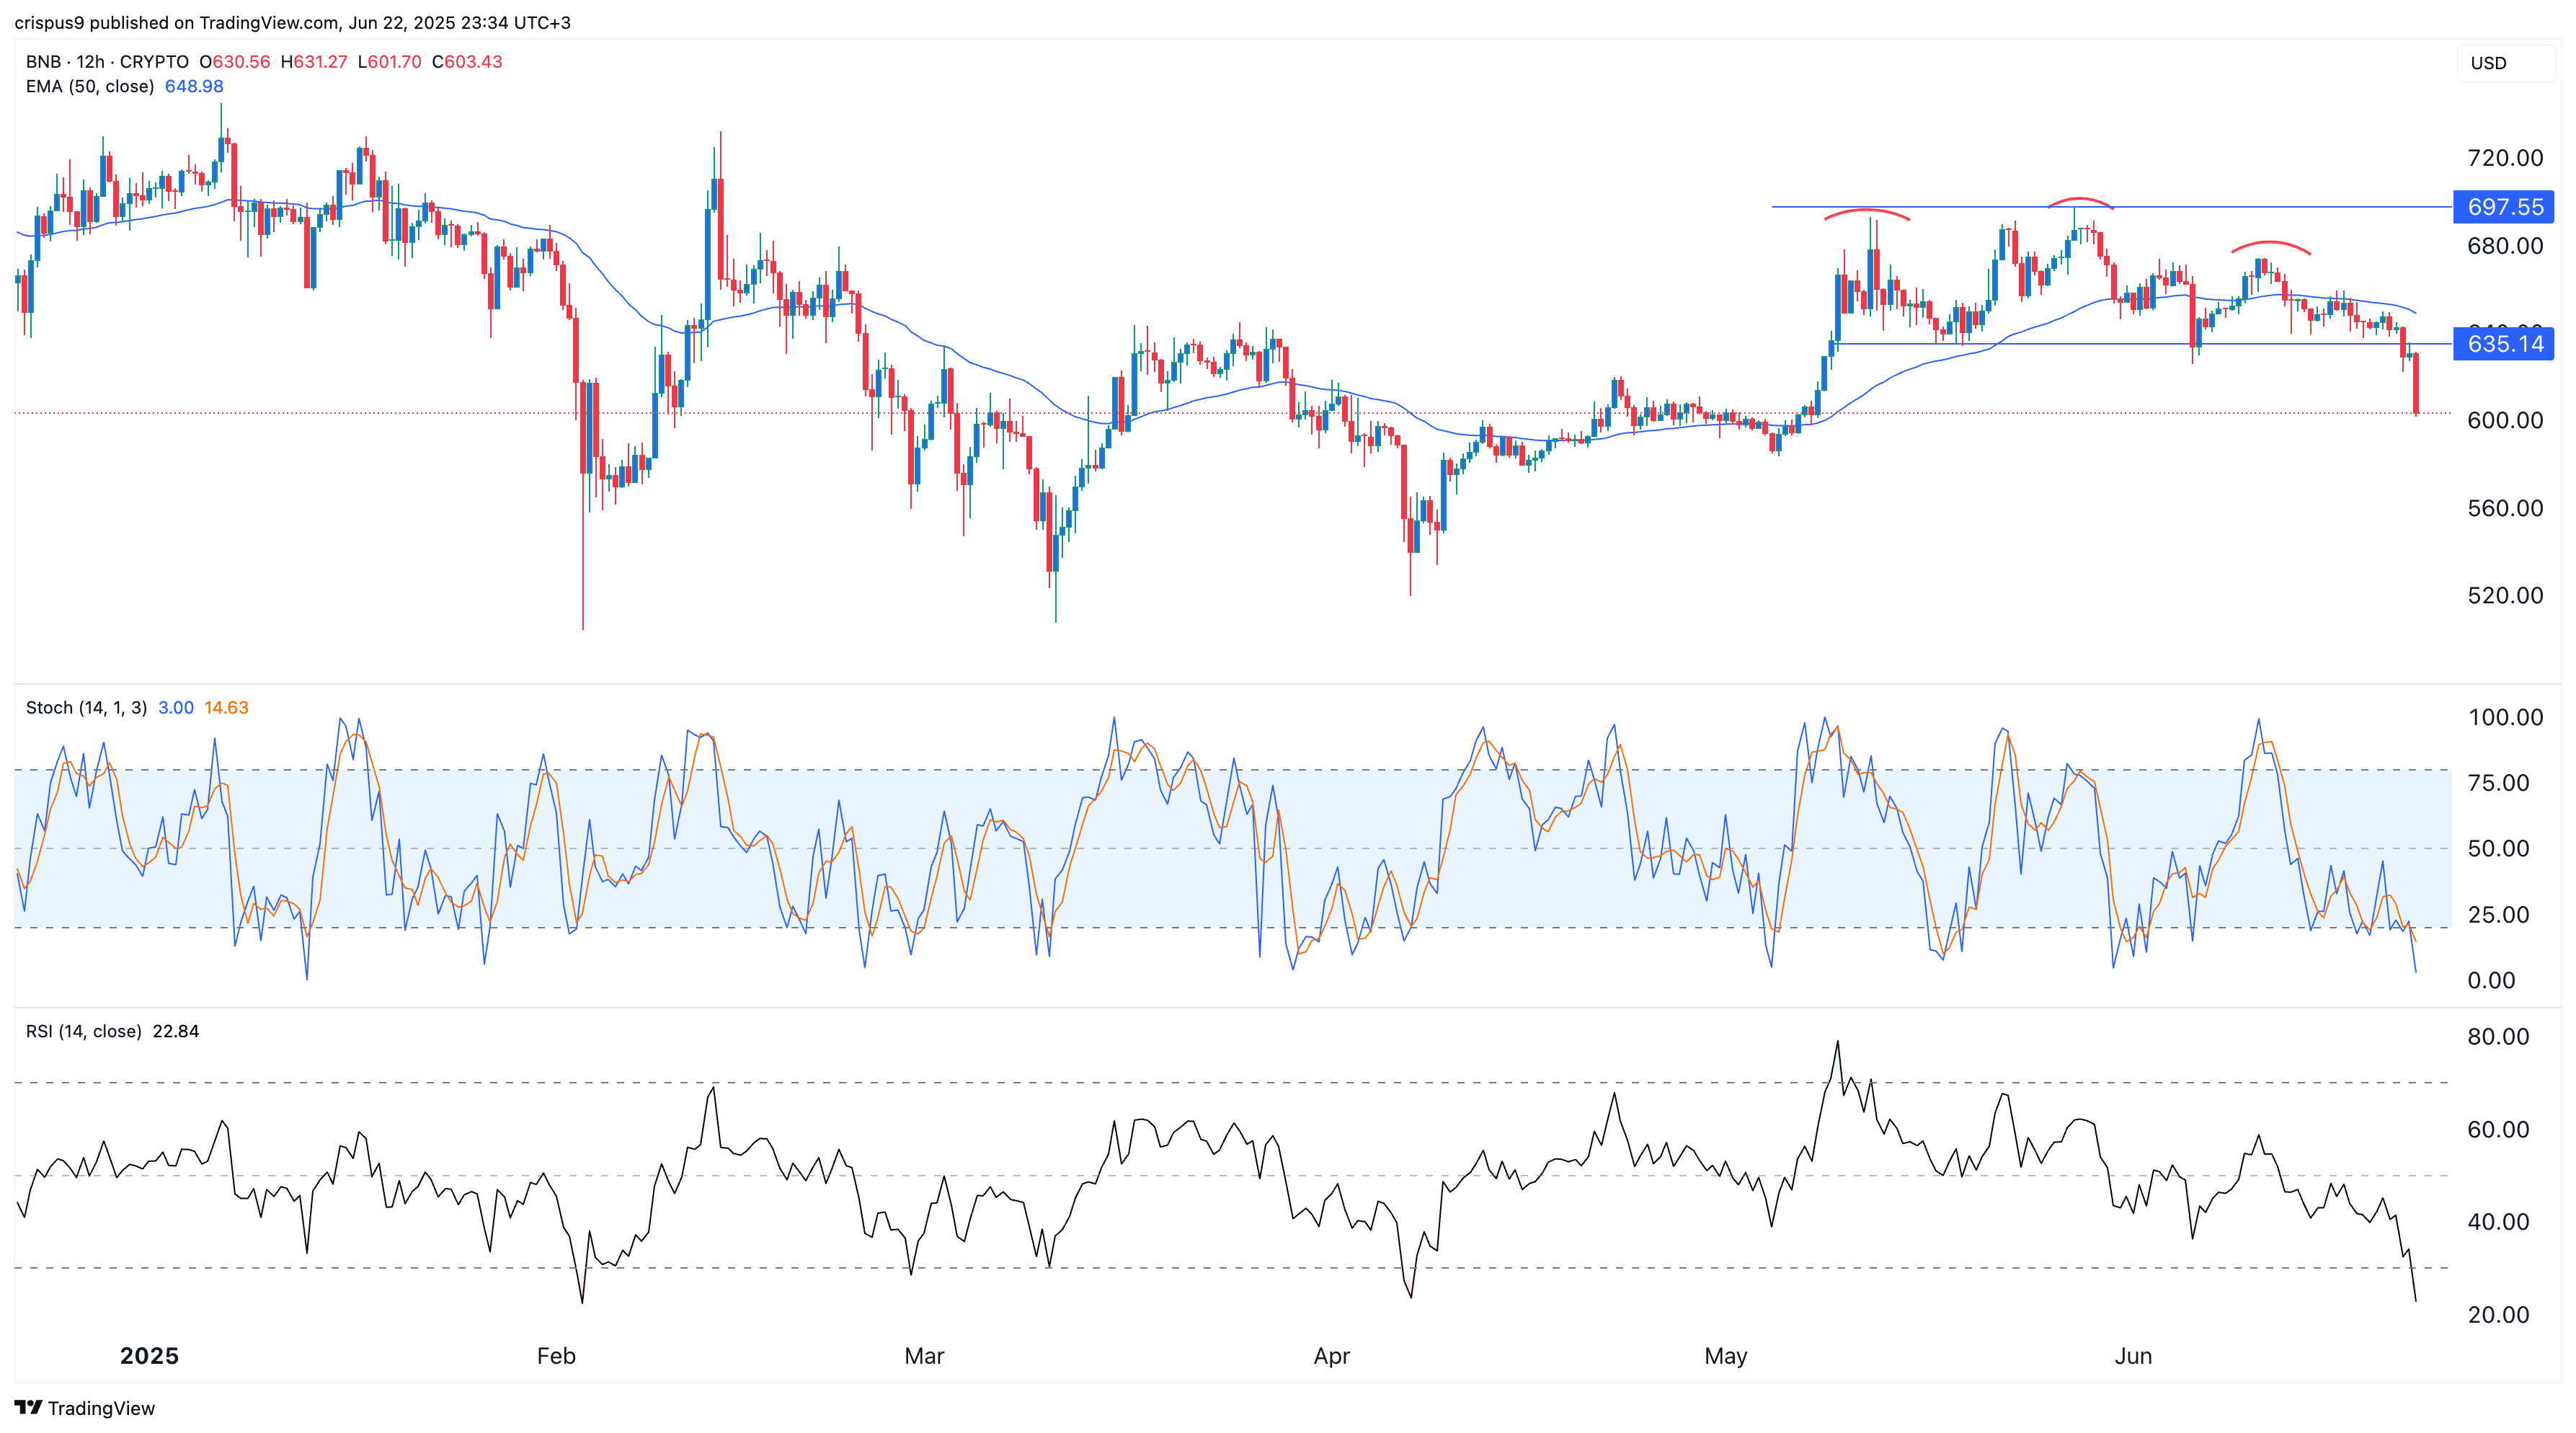
The 12-hour chart shows that the BNB price has been in a strong downtrend in the past few days. It has moved from a high of $697.55 on May 27 to nearly $600 today.
The token has formed a head-and-shoulders pattern, a popular bearish reversal sign. It has moved below the neckline at $635, a sign that bears have prevailed.
The BNB token price plunged below the 50-period moving average. Similarly, the Relative Strength Index (RSI) and the Stochastic Oscillator have pointed downwards.
Therefore, the token is likely to continue falling as sellers target the support level at $500. It will then bounce back in the long term, as bulls target the psychological $1,000 point. The bullish view is because it has formed a cup-and-handle pattern on the weekly chart.
READ MORE: Crypto Crash Explained: Here’s Why Altcoins are Going Down