


The Pepe Coin price has remained in a narrow range over the past few weeks, and the charts send mixed signals. It was trading at the psychological point of $0.000010, down by 40% from its highest point in May.
Pepe Coin Price Chart Points to a Crash
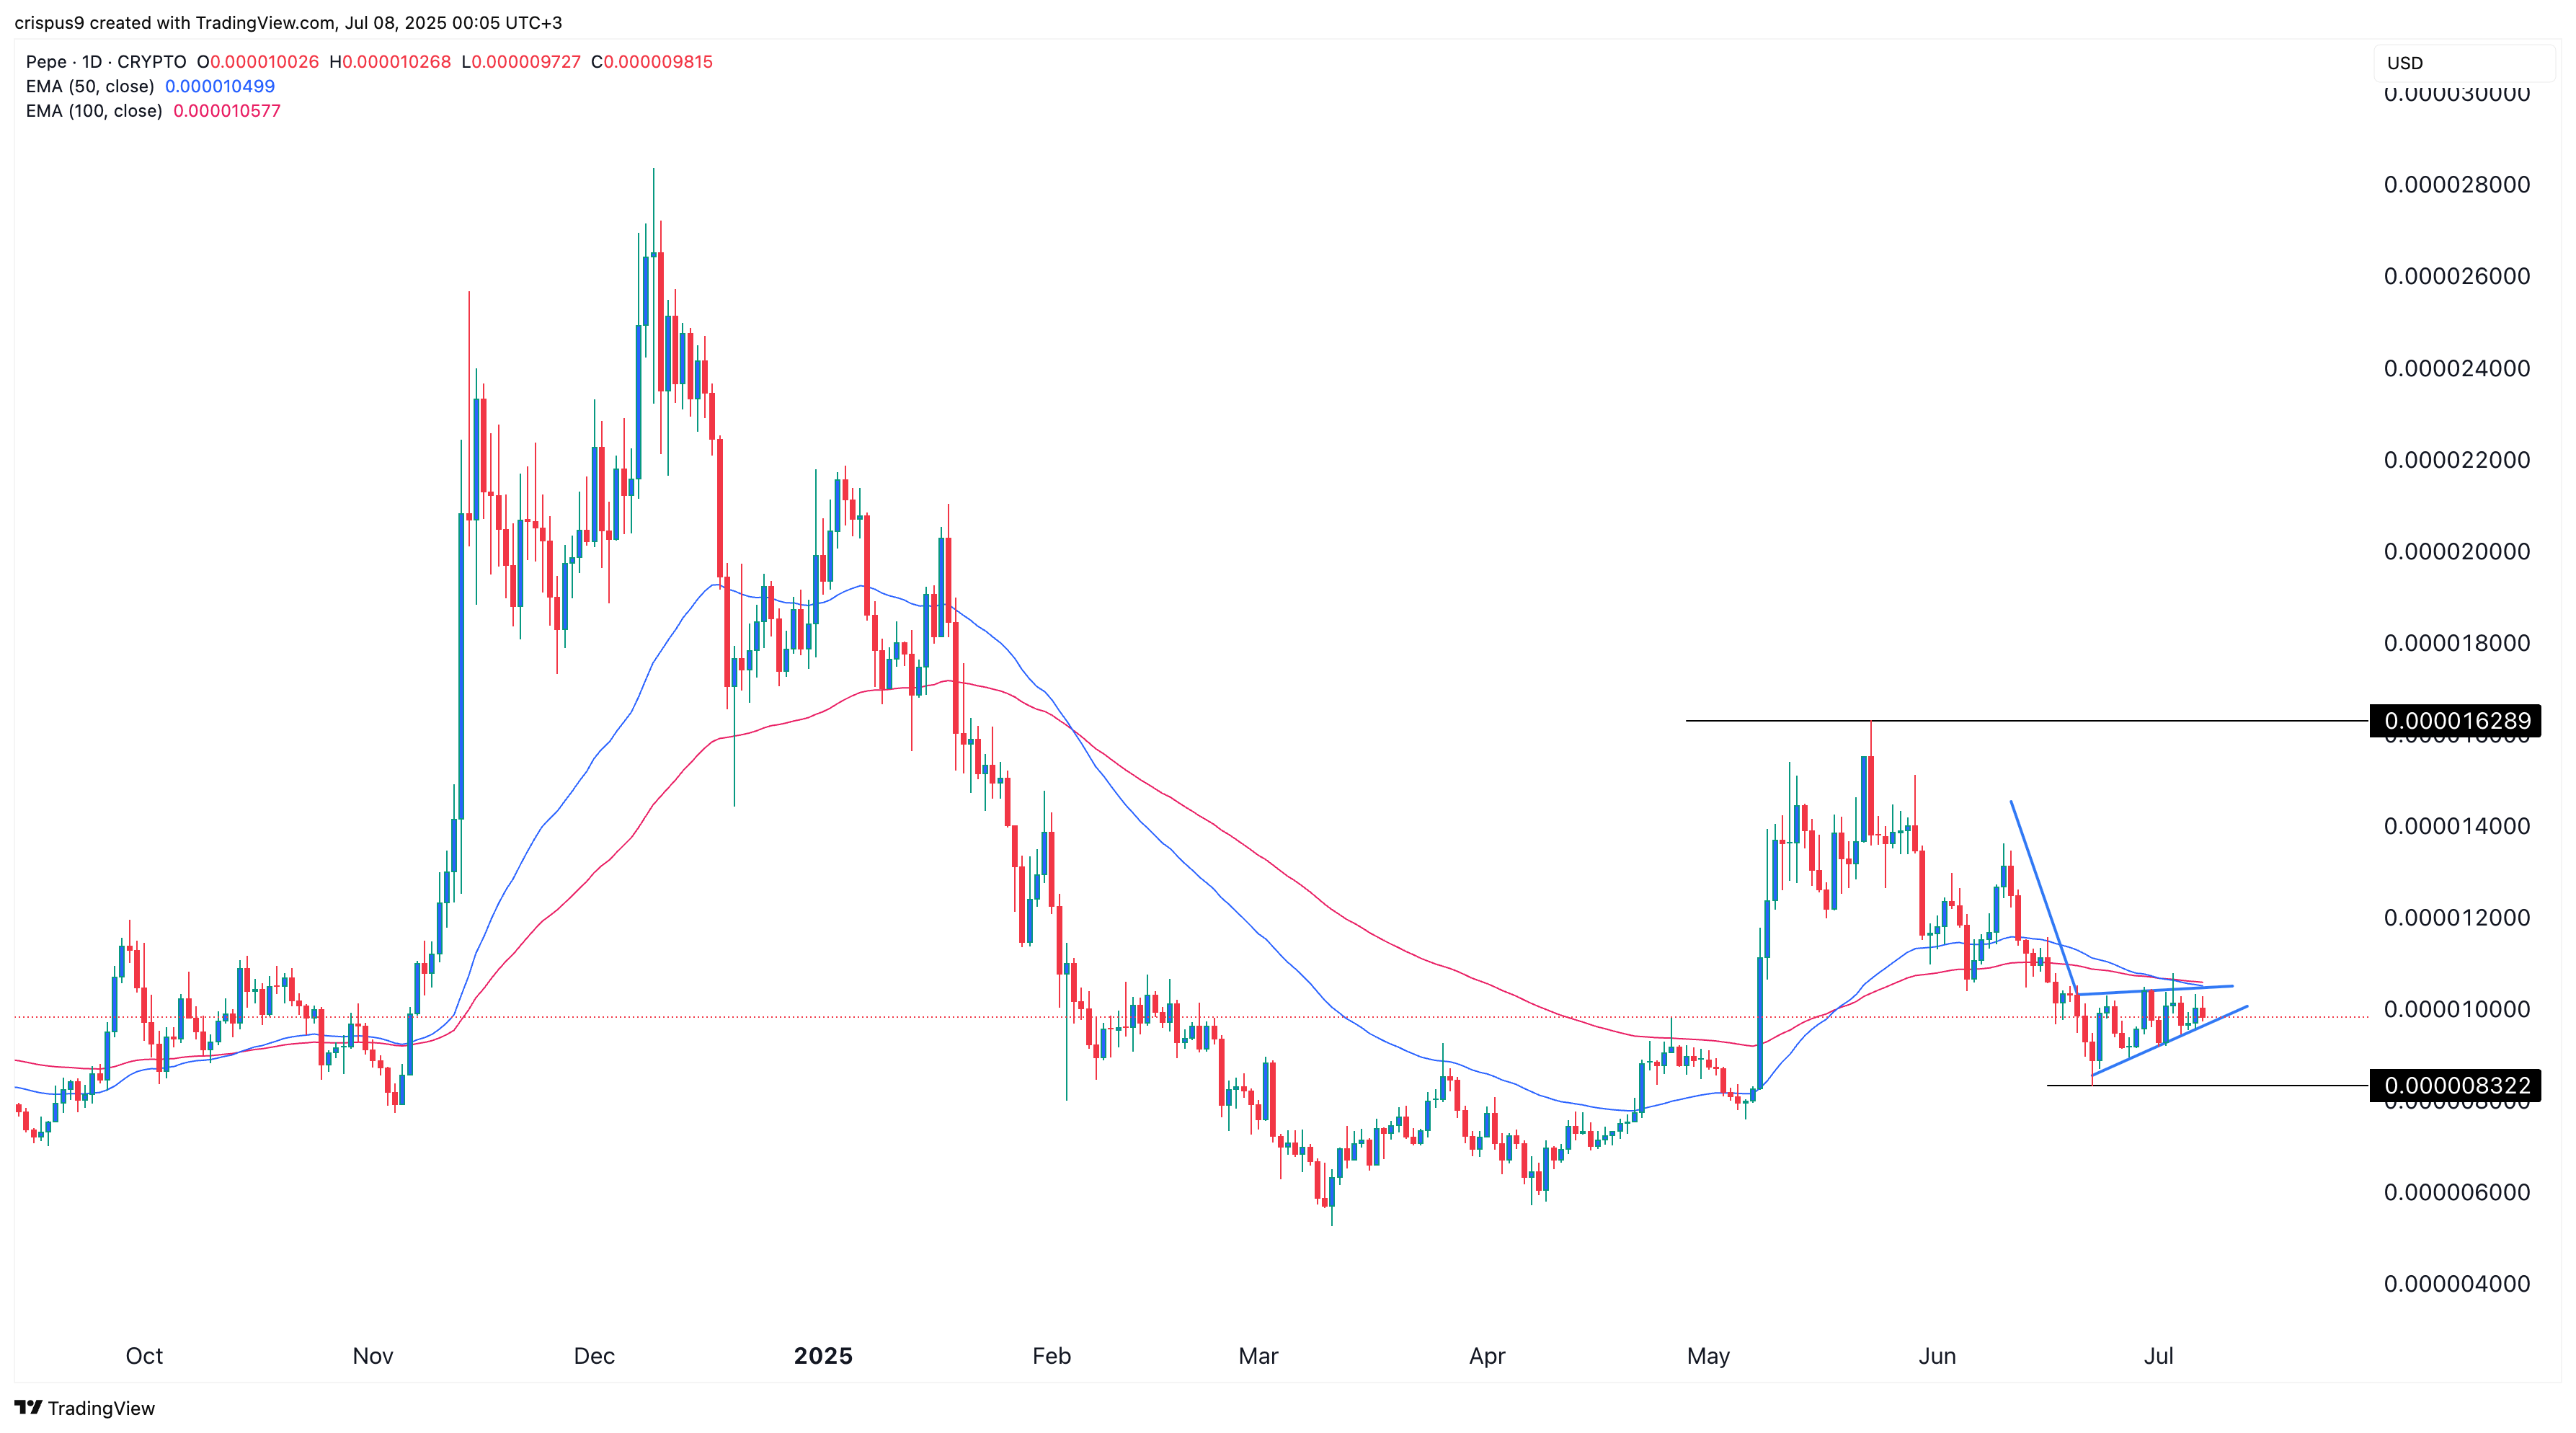
The daily chart shows that the Pepe price surged to $0.00001628 in May as the crypto market rebounded. It then retreated and moved to a low of $0.0000083 on June 22.
This chart shows that the coin is at a crossroads and could break out in either direction in the coming days.
On the negative side, it has formed a bearish pennant pattern comprising a vertical line and a symmetrical triangle, which often leads to more downside. This breakdown may happen soon since the two trendlines are about to converge.
The bearish Pepe price forecast is further emphasized by the fact that the 50-day and 100-day moving averages have made a bearish crossover pattern, which often leads to more downside.
Therefore, if this pattern works, the token will likely have a bearish breakdown, with the initial target to watch is at $0.0000083, the lowest swing in June.
A break below that level will indicate further downside, potentially to the support at $0.000007534, the lowest swing point on May 6 this year.
READ MORE: Cardano Price Prediction: Here’s Why ADA is on the Brink
Pepe Price Chart Signals a Rebound is Possible
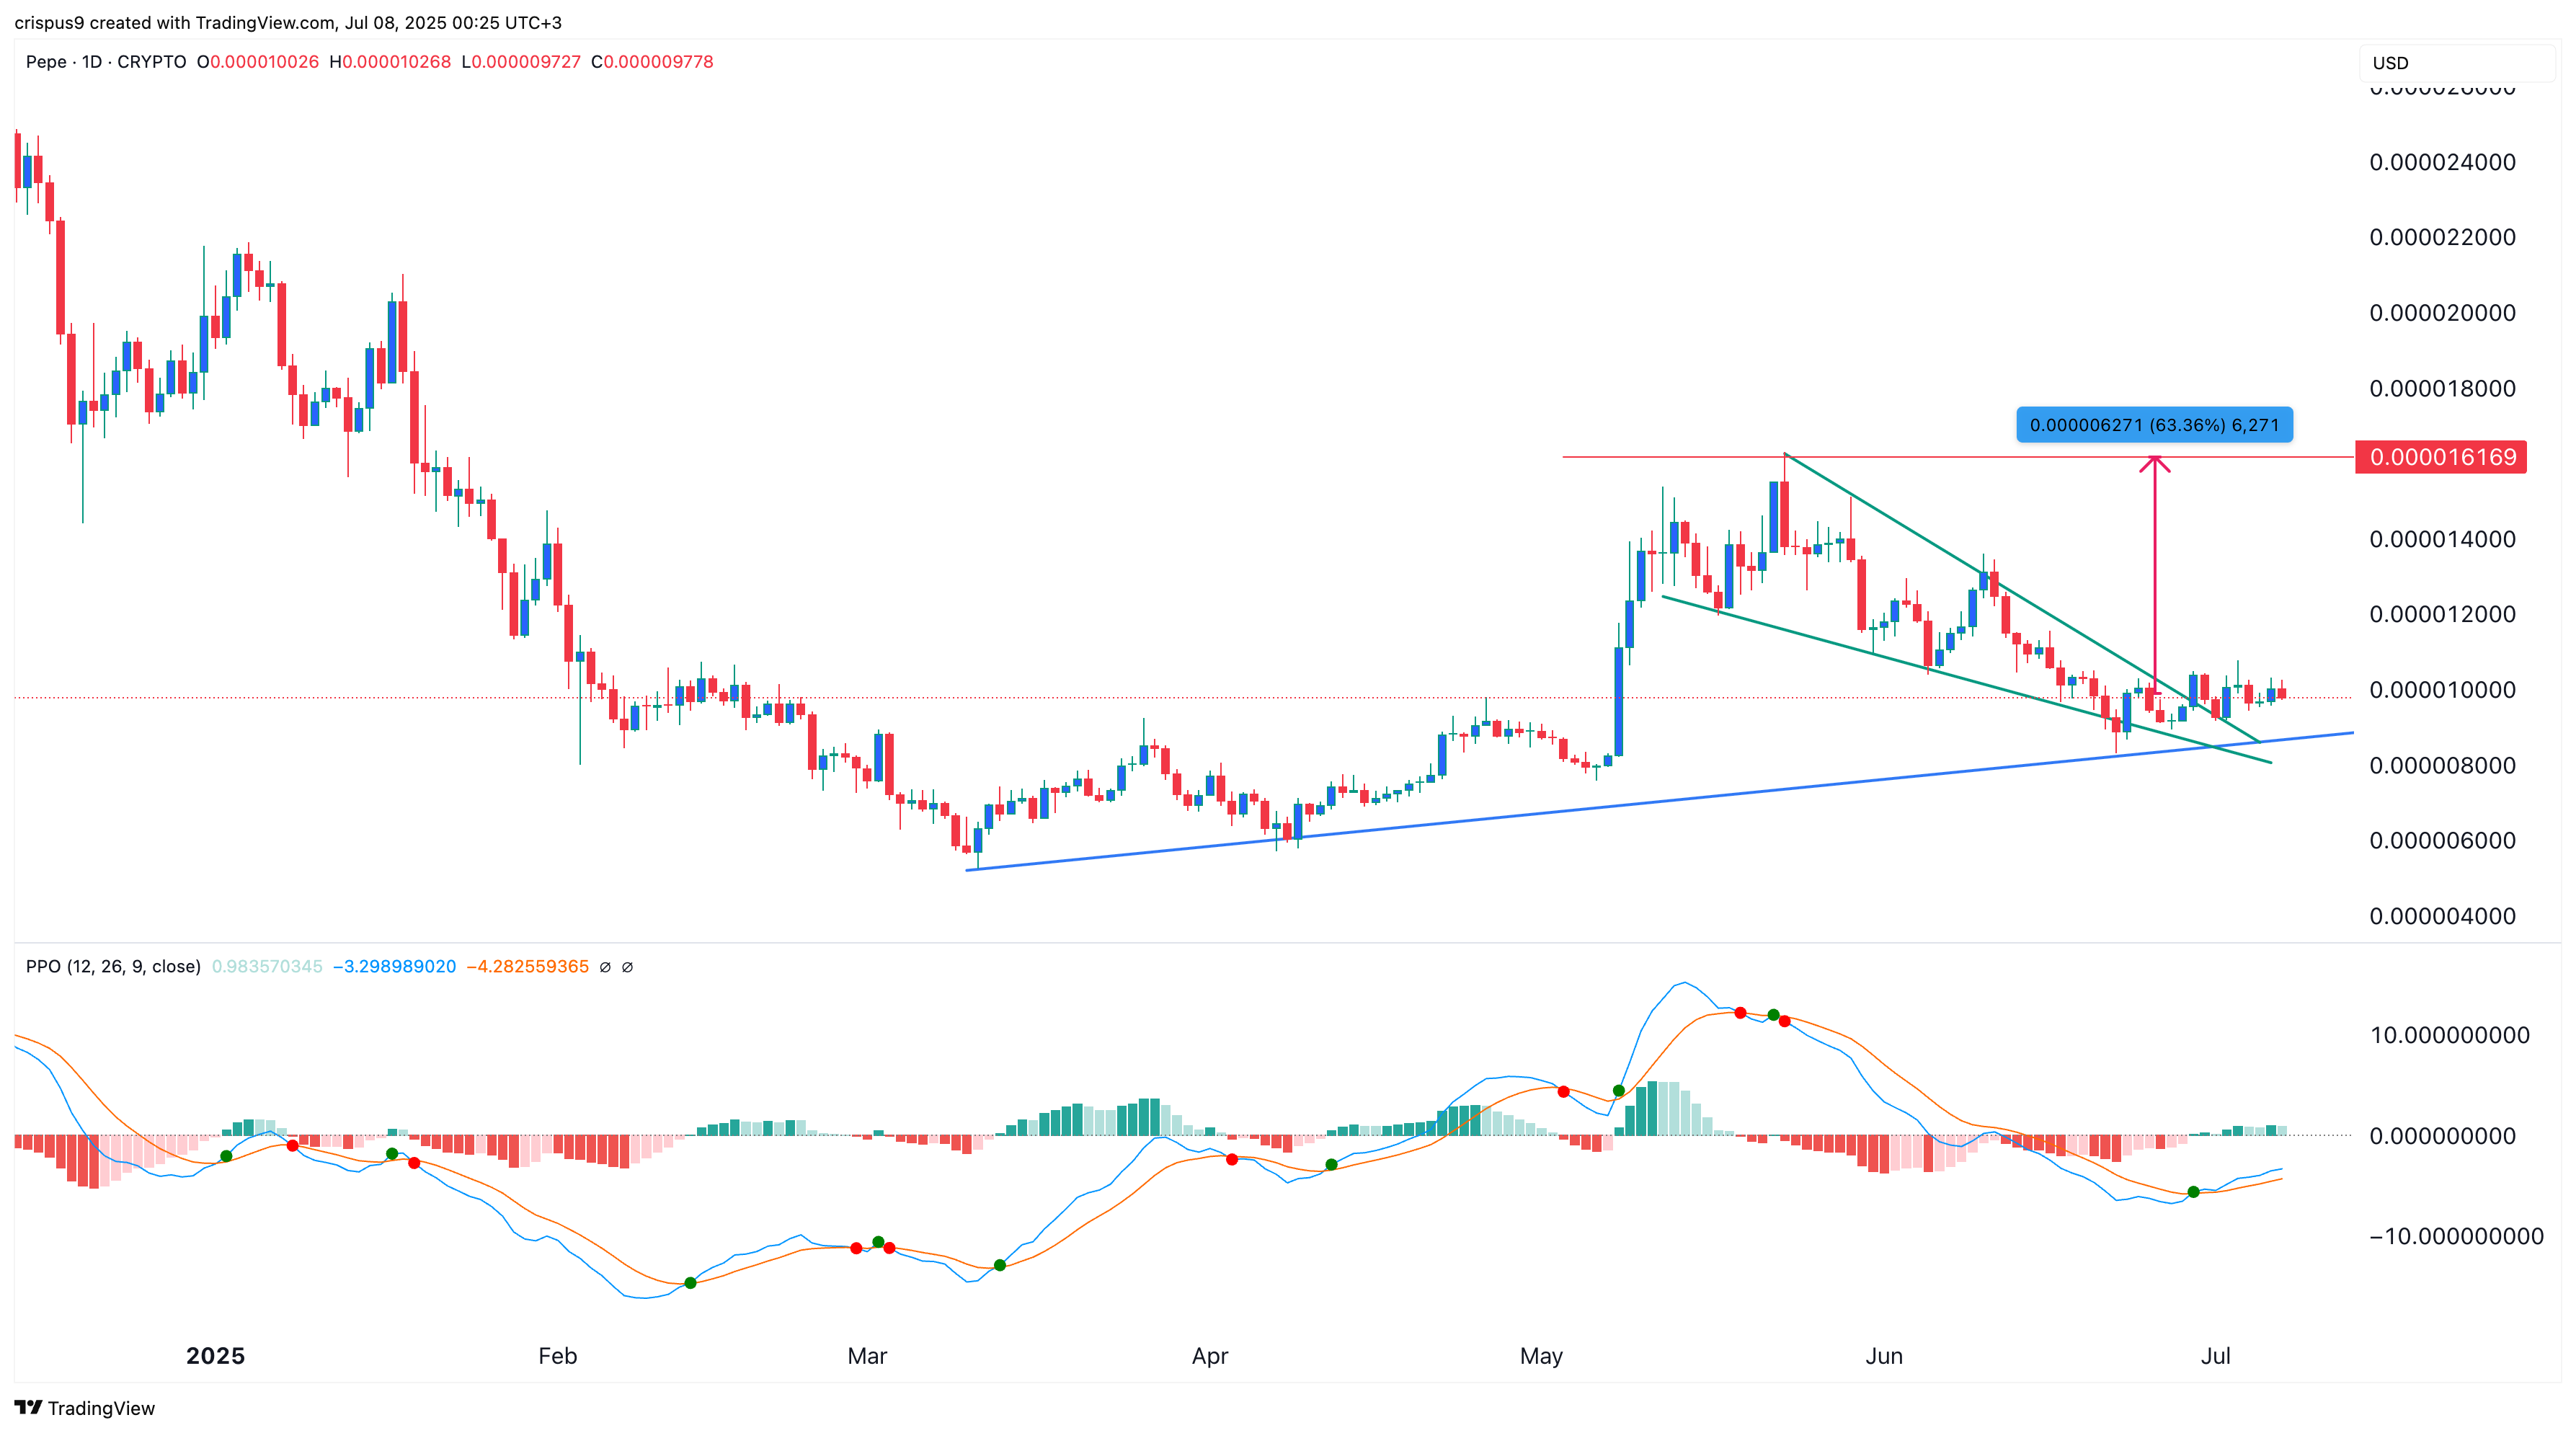
The Pepe Coin price has also formed several bullish patterns that may point to more gains in the coming weeks. It has remained above the ascending trendline that connects the lowest swings since March this year. This trendline has formed substantial support in this period.
Further, Pepe’s price has also formed a falling wedge pattern, comprising two falling and converging trendlines. A wedge is a highly popular bullish reversal pattern, and a bullish breakout happens when the two lines are about to converge.
Pepe has also formed a bullish crossover pattern as the two lines of the Percentage Price Oscillator (PPO) have crossed each other. In this case, a bullish breakout will see it jump and retest the key price at $0.00001616, the highest point in May, which is about 63% above the current level.
The Bottomline
The daily chart is sending mixed signals about what will be expected in the coming days. In this case, the coin may break out in either direction. The key level to watch will be the ascending trendline. A move below it will confirm a bearish breakdown and indicate further downside.
READ MORE: Polkadot Price Prediction as Analyst Explains the DOT Crash