The Dogecoin price has crawled back over the past few days, despite on-chain data indicating whale selling. The DOGE token rose to the important resistance point at $0.20, its highest point since June 11, and 40% above its lowest point in June.
Whales are Selling DOGE Coins
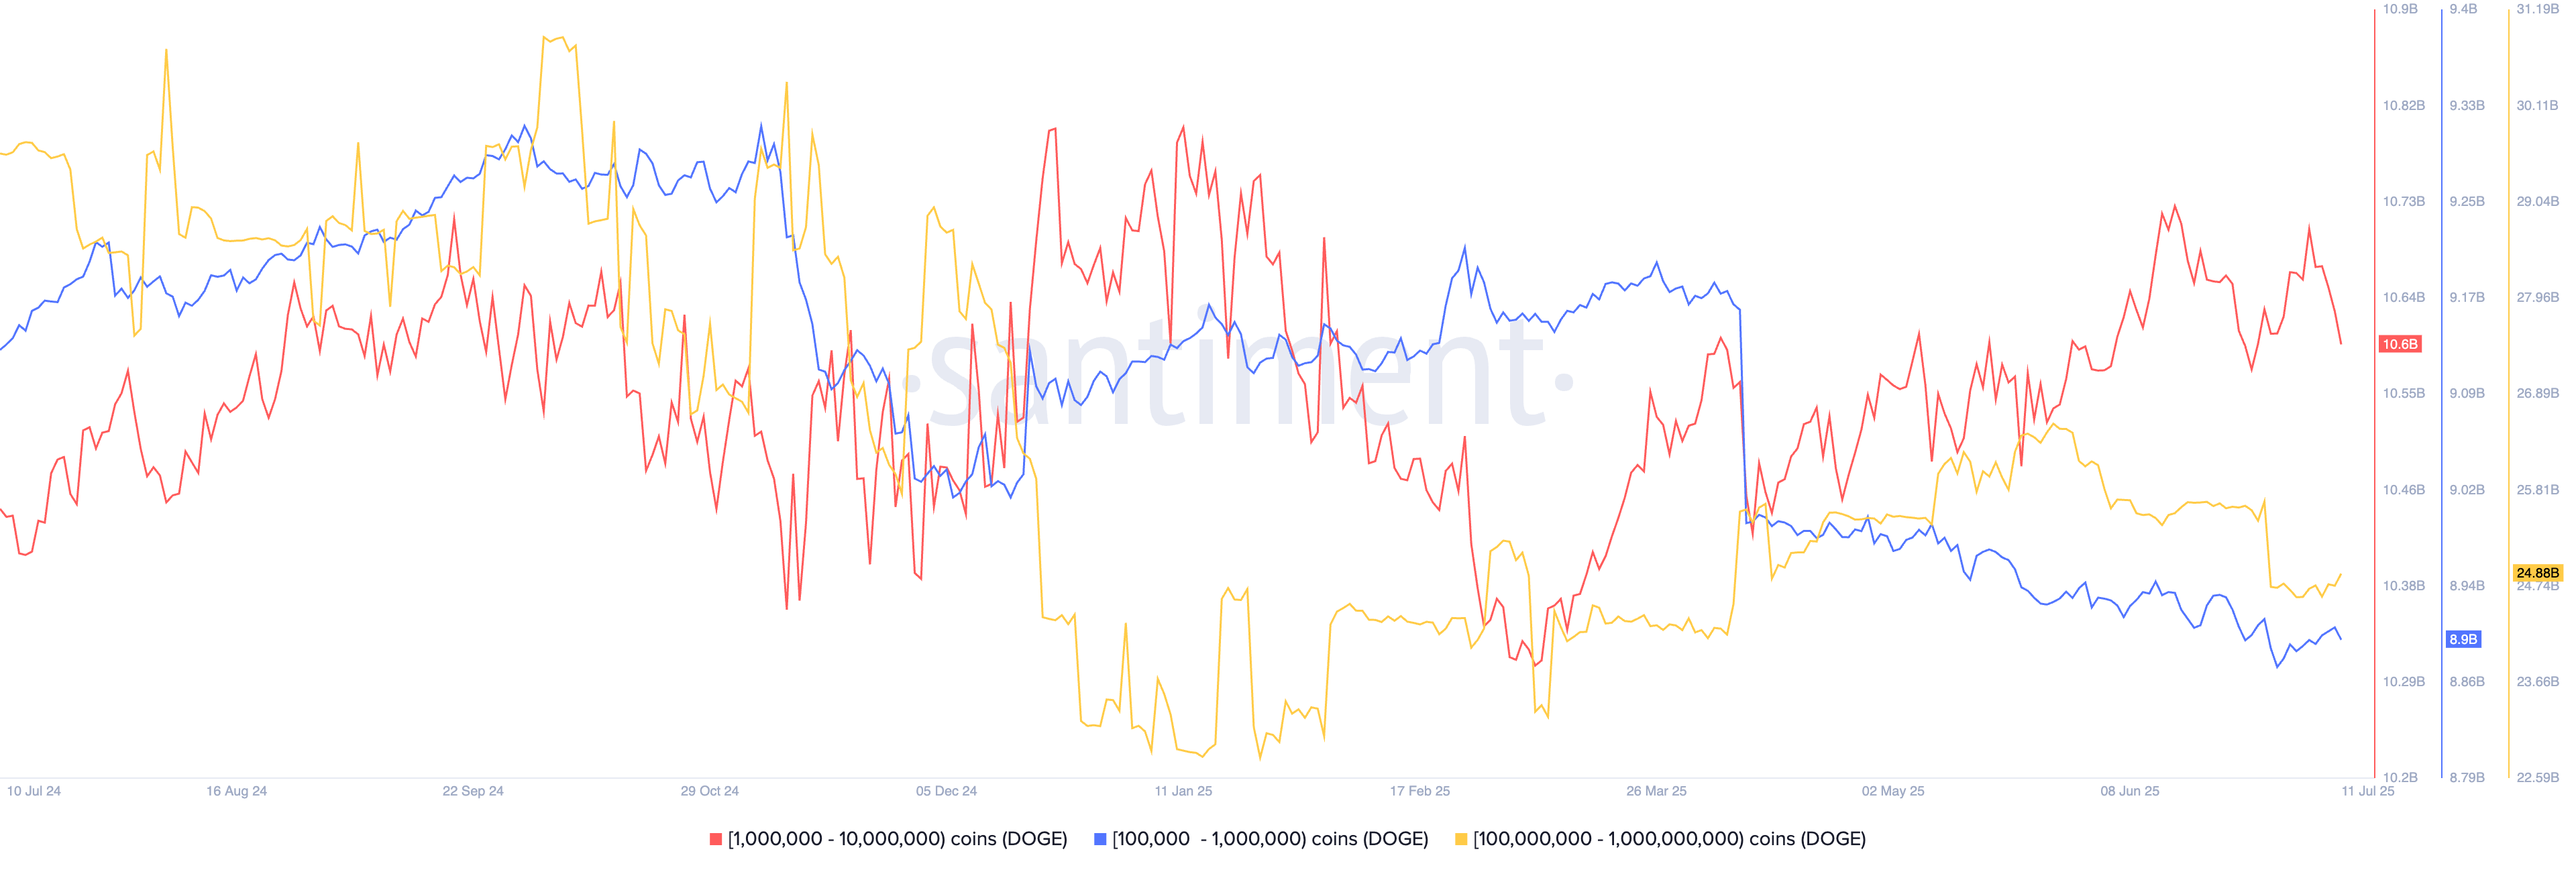
The Dogecoin price has rebounded over the past few days, even as on-chain metrics indicate whale selling. Data shows that DOGE holders with between 1 million and 10 million coins have reduced their holdings from 10.7 billion on July 6 to 10 billion today.
The same trend happened among those holding between 100 million and 1 billion coins, who hold 24.8 billion tokens, down from 26.5 billion earlier this month.
More data shows that DOGE holders with between 100k and 1 million coins have 8.9 billion, down from the March high of 9.2 billion.

Dogecoin whale transactions | Source: Santiment
READ MORE: Solana Price Analysis as the Staking SOL ETF Assets Surges
Still, there are a few reasons why the DOGE price may continue to rise in the near term.
First, Polymarket data indicate that the odds of the Securities and Exchange Commission (SEC) approving a spot DOGE ETF have increased over the past few days. They have moved to 80% from a low of 44% in June.
A DOGE ETF is possible because it is a proof-of-work cryptocurrency like Bitcoin and Ethereum, and the SEC does not view it as a security. It is also a giant asset with a market capitalization of over $30 billion.
Second, Dogecoin remains a relatively inexpensive coin, with an MVRV-Z score of 0.739, significantly lower than the 5.8 recorded in November last year. The MVRV indicator has pointed upwards, a sign that the coin is gaining momentum.
Third, the Dogecoin price is likely to benefit from the ongoing crypto bull run, which may push Bitcoin to over $150,000, as we predicted earlier.
Dogecoin Price Technical Analysis

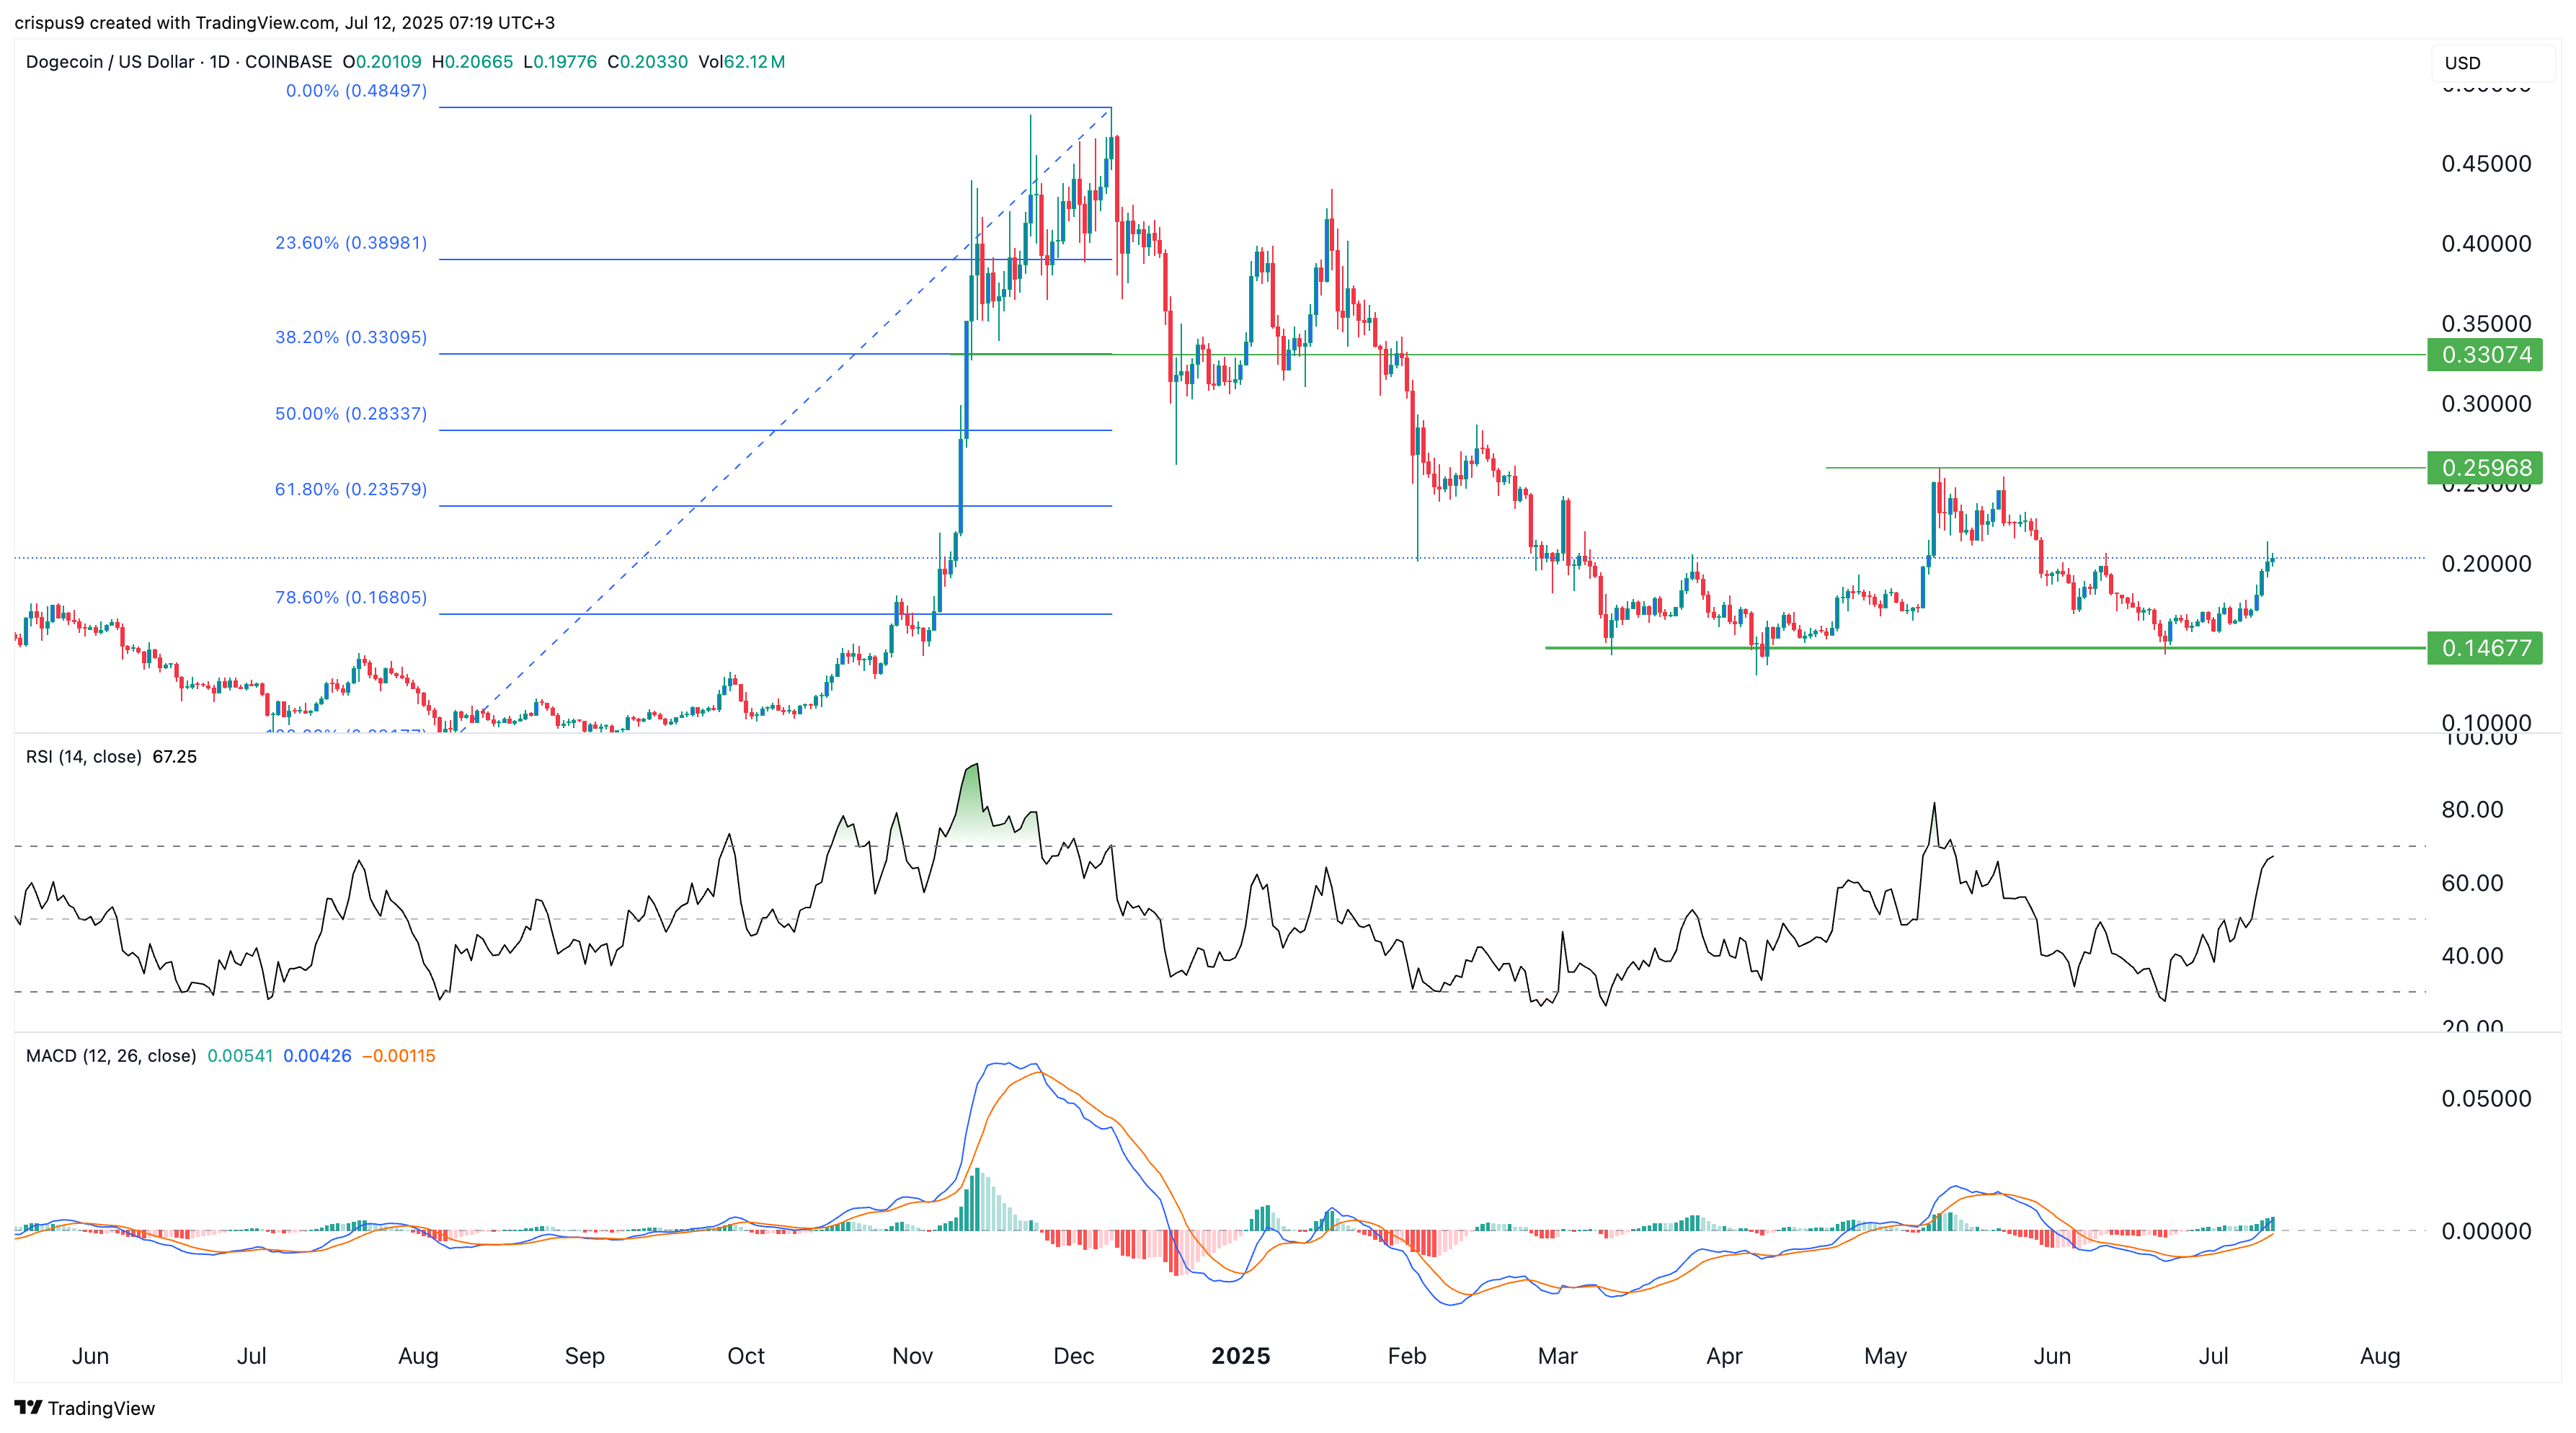
The other bullish catalyst is that the DOGE price formed a double-bottom pattern at $0.1467 on April 8 and June 22. This pattern often leads to a strong recovery over time.
Dogecoin’s Relative Strength Index (RSI) has jumped to 67, its highest level since May 14. The MACD indicator has moved close to the zero line and is pointing upwards.
Therefore, the token will likely continue rising as bulls target the next key resistance point at $0.2596, the neckline of the double-bottom pattern. A move above that level will indicate further gains, potentially reaching $0.3300, the 38.2% Fibonacci Retracement level.
READ MORE: Pi Network Price Analysis: Here’s Why Pi Coin is Set to Soar in Value


