


HBAR price continued its strong rally on Monday, July 23rd, and is showing signs of more gains. Hedera has flashed a rare chart pattern known as a golden cross as its stablecoin growth gains steam. It was trading at $0.28, up by 122% from its lowest point in June this year.
HBAR Price Flashes Golden Cross, Double Bottom
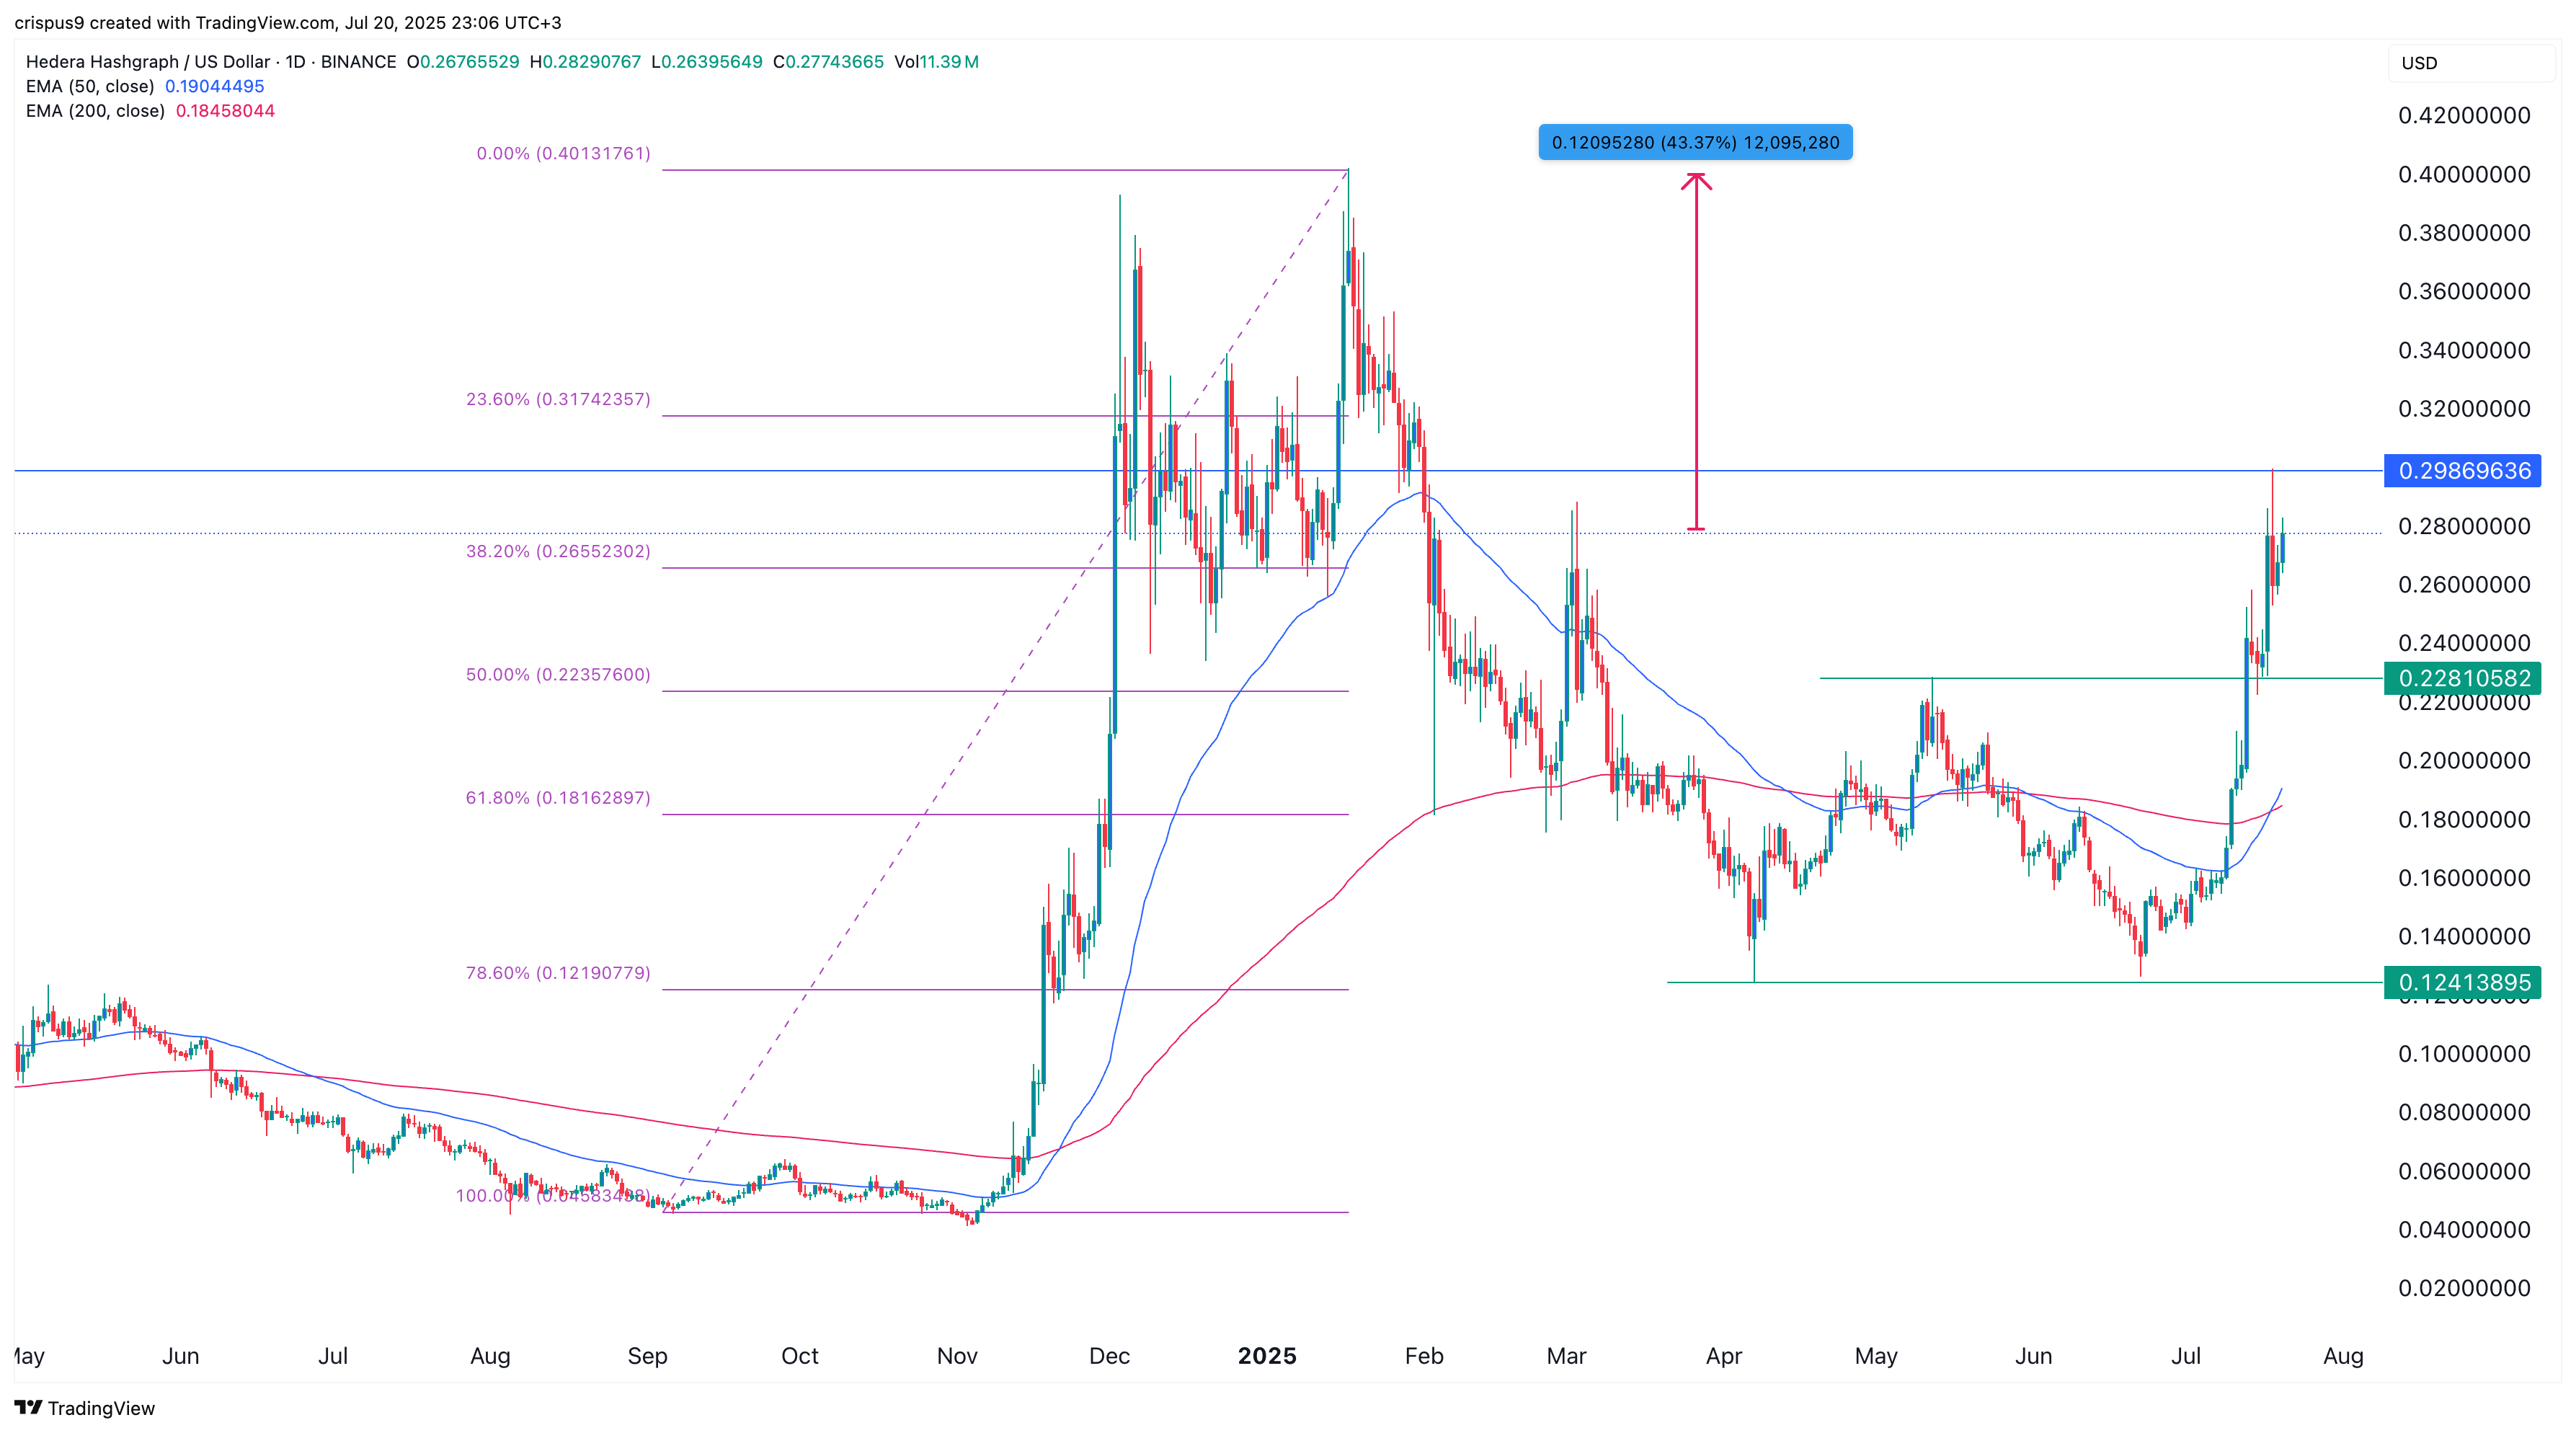
The daily chart shows that the HBAR price began its comeback after reaching a low of $0.1241 in June. This was a notable level as it coincided with the lowest point on April 7th. The pattern is known as a double-bottom and is one of the most bullish signs in technical analysis.
The Hedera price has moved above the neckline at $0.2281, its highest swing point in May this year, confirming a bullish breakout. It has also flashed a golden cross pattern, which occurs when the 50-day and 200-day moving averages cross each other and point upwards.
A golden cross means that recent price trends are gaining strength compared to longer-term ones. It has also moved above the 38.2% Fibonacci Retracement level, while the Relative Strength Index (RSI) has pointed upwards.
Therefore, the token is likely to continue soaring, with the following key point to watch being at $0.40, which is approximately 43% above the current level. This target aligns with the highest point in November last year. A drop below the double-bottom’s neckline at $0.2281 will invalidate the bullish view.
READ MORE: ZBCN Price Forms Engulfing as Zebec Network Growth Continues
Top 3 Catalysts for Hedera Hashgraph Token
Hedera Hashgraph token has two main catalysts that may push it higher in the coming weeks. First, Hedera’s total value locked in decentralized finance has jumped by over 86% in the last 30 days to over $288 million.
This is a sign that investors are allocating cash to some of its protocols, especially Stader and SaucerSwap. The 24-hour volume in its DEX protocols soared to over $20 million.
Second, and most importantly, the amount of stablecoins in the network has jumped in the past few weeks. It has soared to over $192 million, up from this month’s low of $150 million, and 27% in the last seven days.
Finally, there are rising odds that the Securities and Exchange Commission (SEC) will approve the spot HBAR ETF before the end of the year. That approval is likely to lead to increased demand for the coin this year.
READ MORE: XRP Price Jumps Amid Saudi Arabia Investment Rumors: FactCheck