


The crypto market remained on edge on Thursday morning, with Bitcoin being stuck in a tight range and most altcoins retreating. Still, some small-cap tokens like Space and Time (SXT), Caldera (ERA), and Chainbase (C) are holding steady.
SXT Price Technical Analysis
Space and Time is a crypto project backed by Microsoft that has developed a zero-knowledge scaling platform. It also operates a proof-of-SQL platform offering sub-second compressors, an artificial intelligence studio, and a blockchain database indexing.
The SXT price began rising in June after Grayscale launched the Space and Time Trust, enabling institutional investors to purchase it. Its rally accelerated this week after the developers launched Blitzar, a hardware acceleration framework that offloads the “hard stuff” to GPUs, speeding the performance of a ZK protocol.
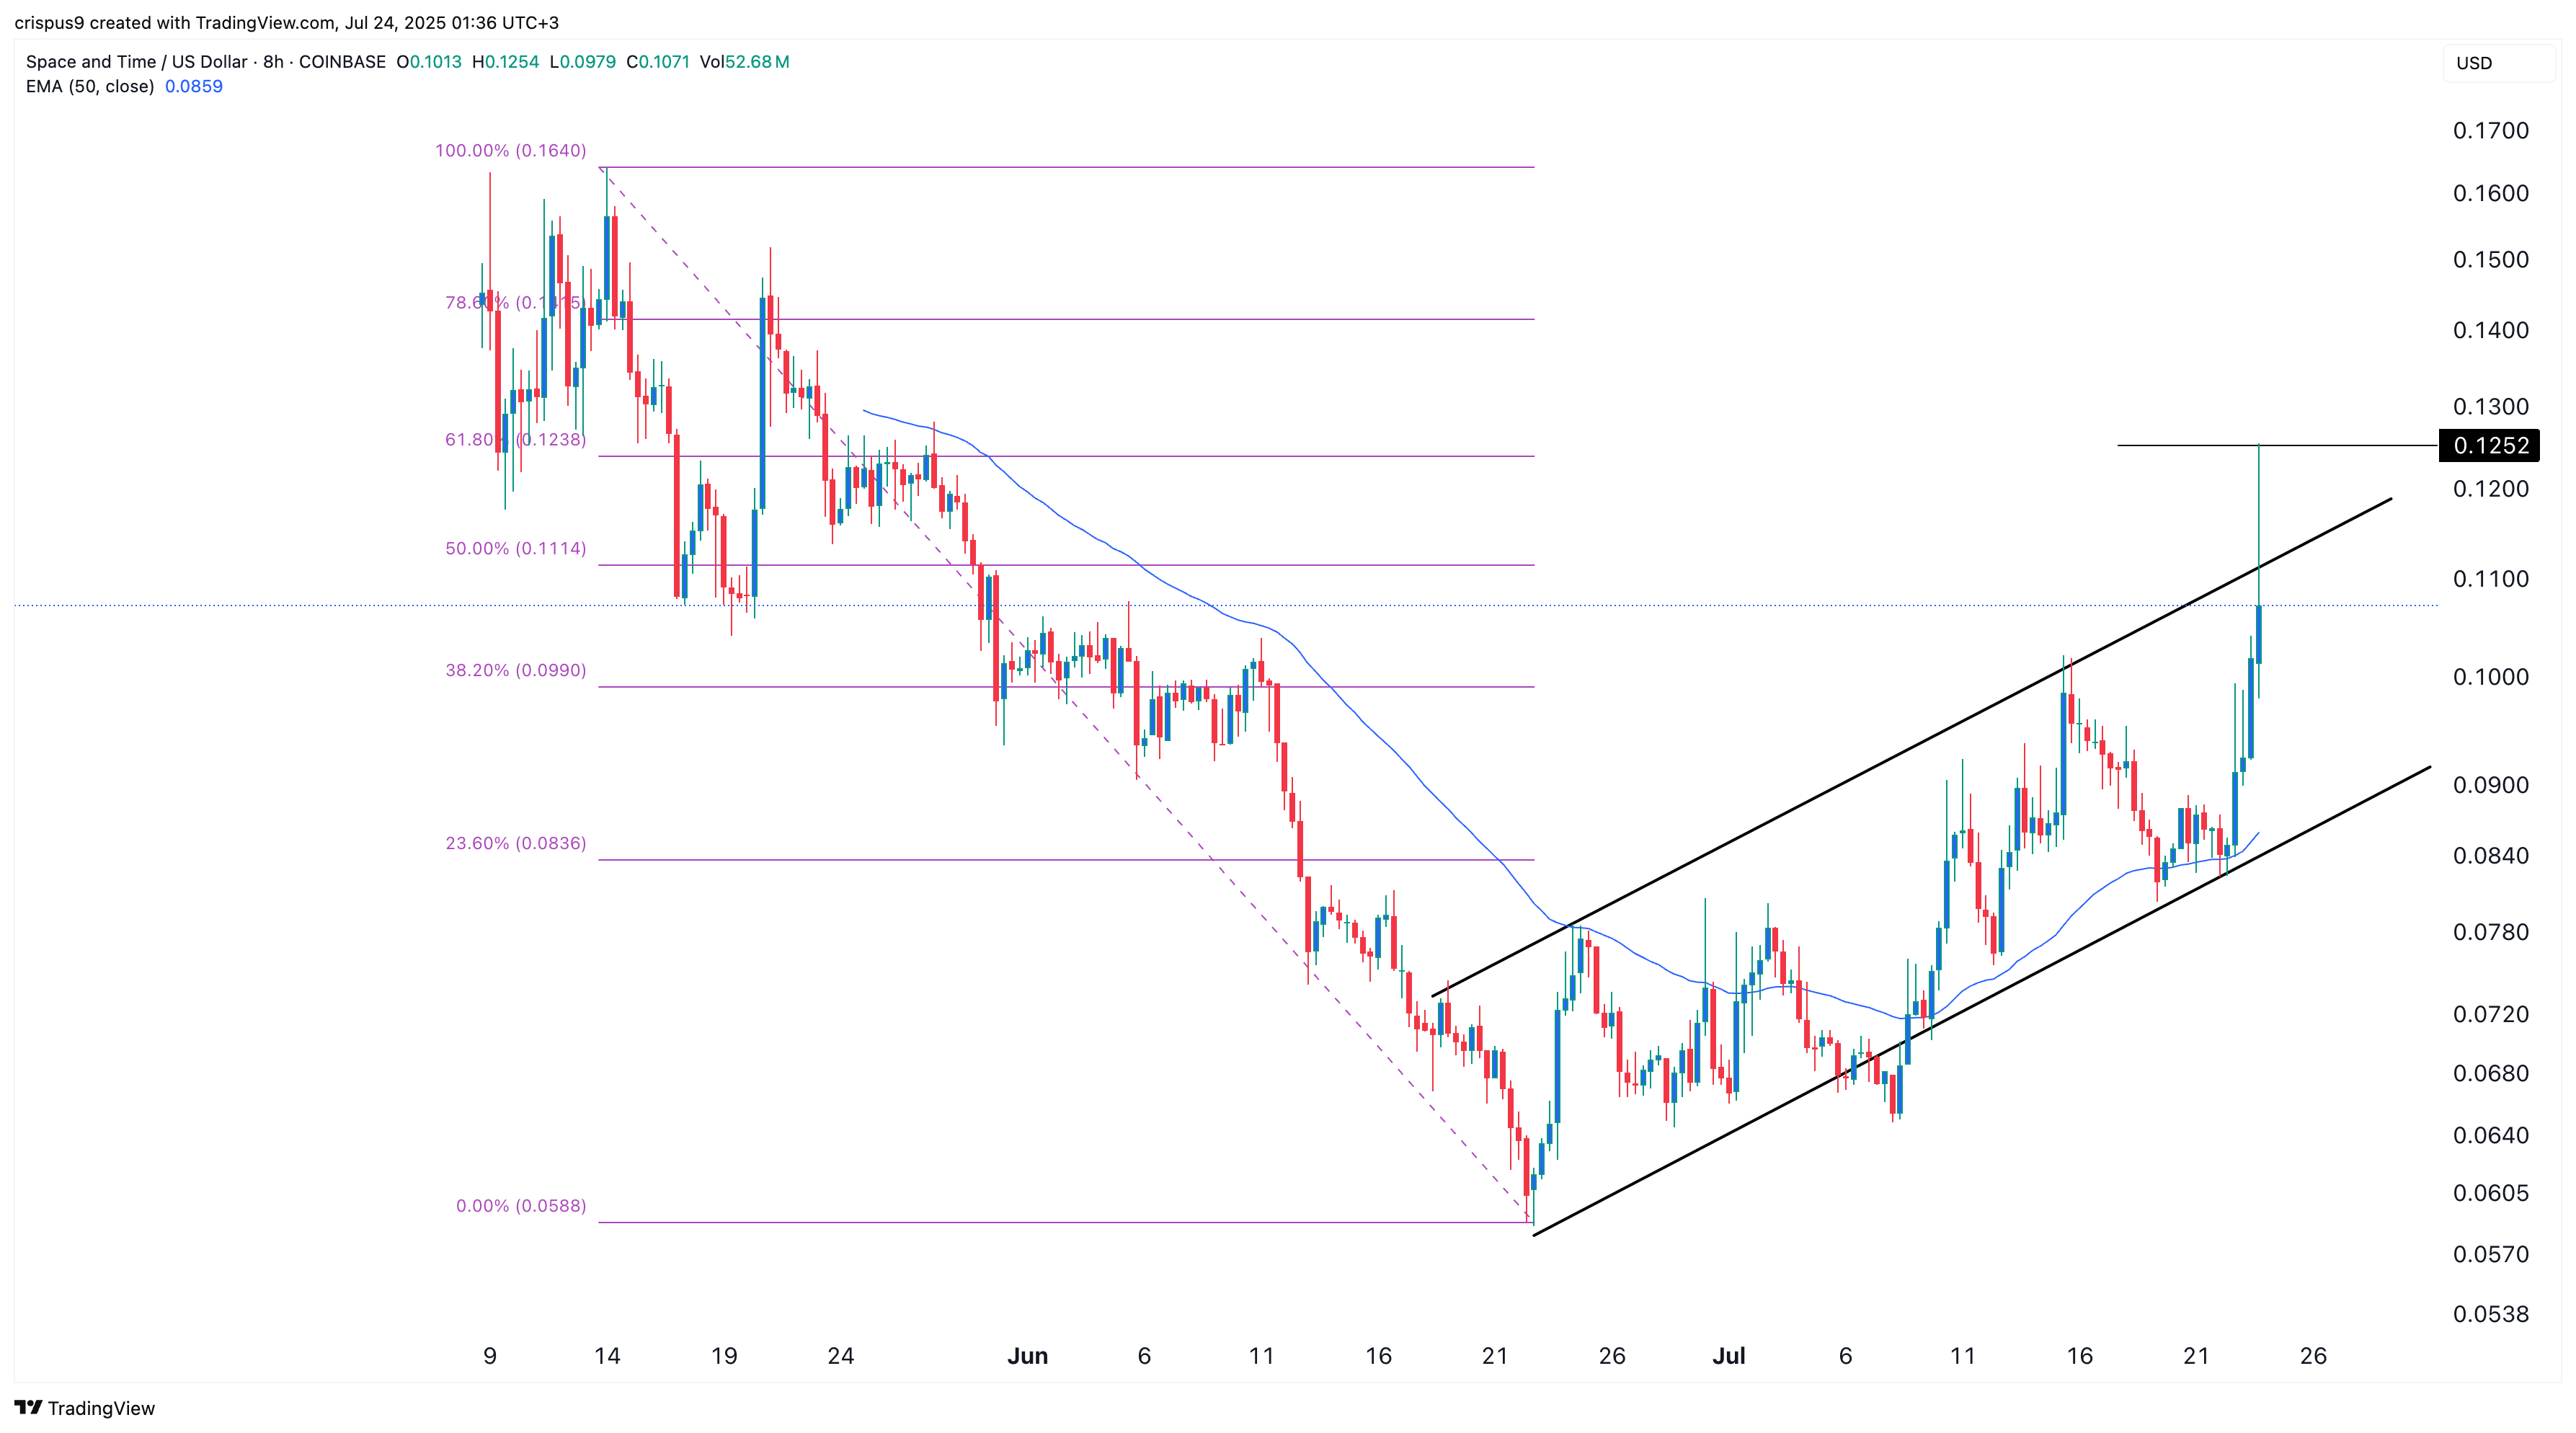
The eight-hour chart shows that the SXT price bottomed at $0.058 in June and then rebounded, peaking at $0.1252 on Thursday. It has formed an ascending channel and remained above the 50-period moving average and the 38.2% Fibonacci Retracement level.
The STX price will likely pull back now that it has retested the upper side of the channel. If this happens, it will likely drop and retest the lower side at $0.09.
READ MORE: XLM and XRP Price Analysis: Why Ripple, Stellar Crypto are Crashing
Caldera Price Analysis
Caldera is a blockchain project that offers rollups, accelerating other chains. It supports over 75 chains and has a total value locked (TVL) of over $1 billion. According to its website, Caldera has handled over 550 million transactions over time.
Caldera price jumped on Wednesday as the network added support for BNB Smart Chain (BSC), one of the biggest players in the crypto industry. It joined its Metalayer and Caldera Bridge. Metalayer connects developers, users, and liquidity across the Ethereum network through a single platform.
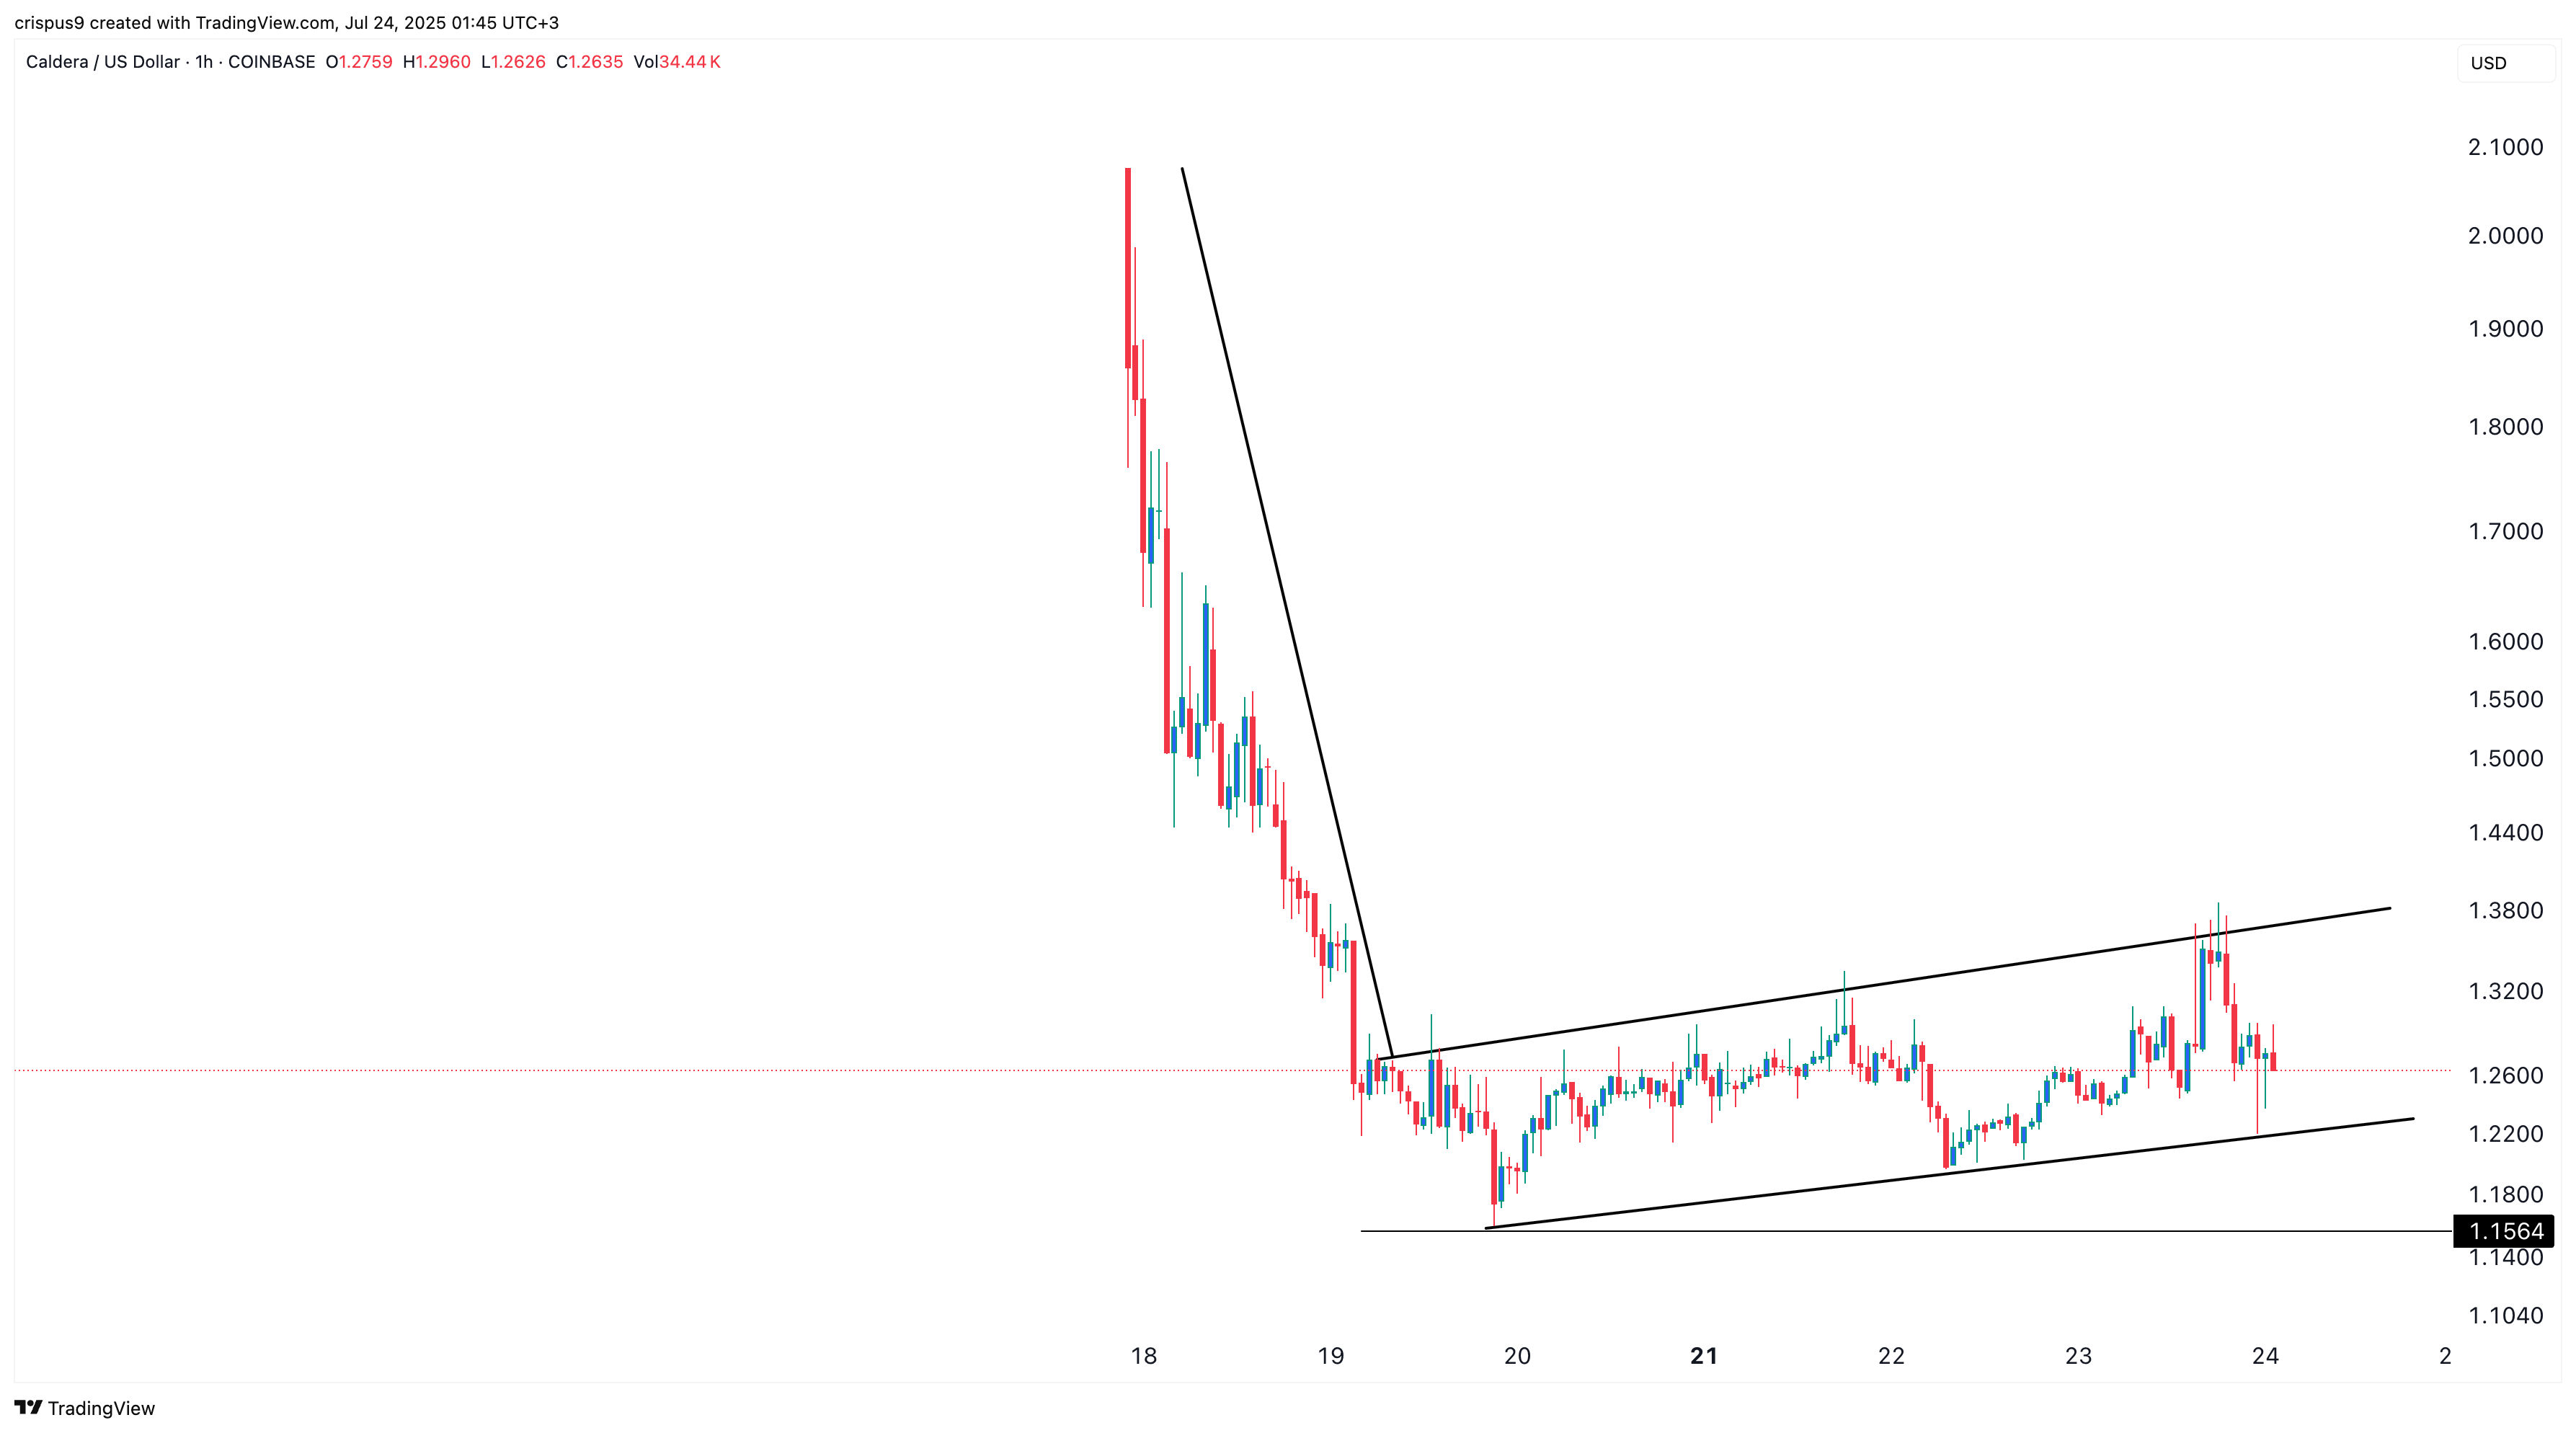
ERA price was trading at $1.2680 on Thursday, a few points higher than the year-to-date low of $1.2200. On the negative side, the Caldera price has formed a bearish flag pattern, indicating an eventual decline. This pattern consists of a vertical line and an ascending or horizontal channel. A bearish breakdown will cause it to drop to its all-time low of $1.1565.
Chainbase Price Analysis
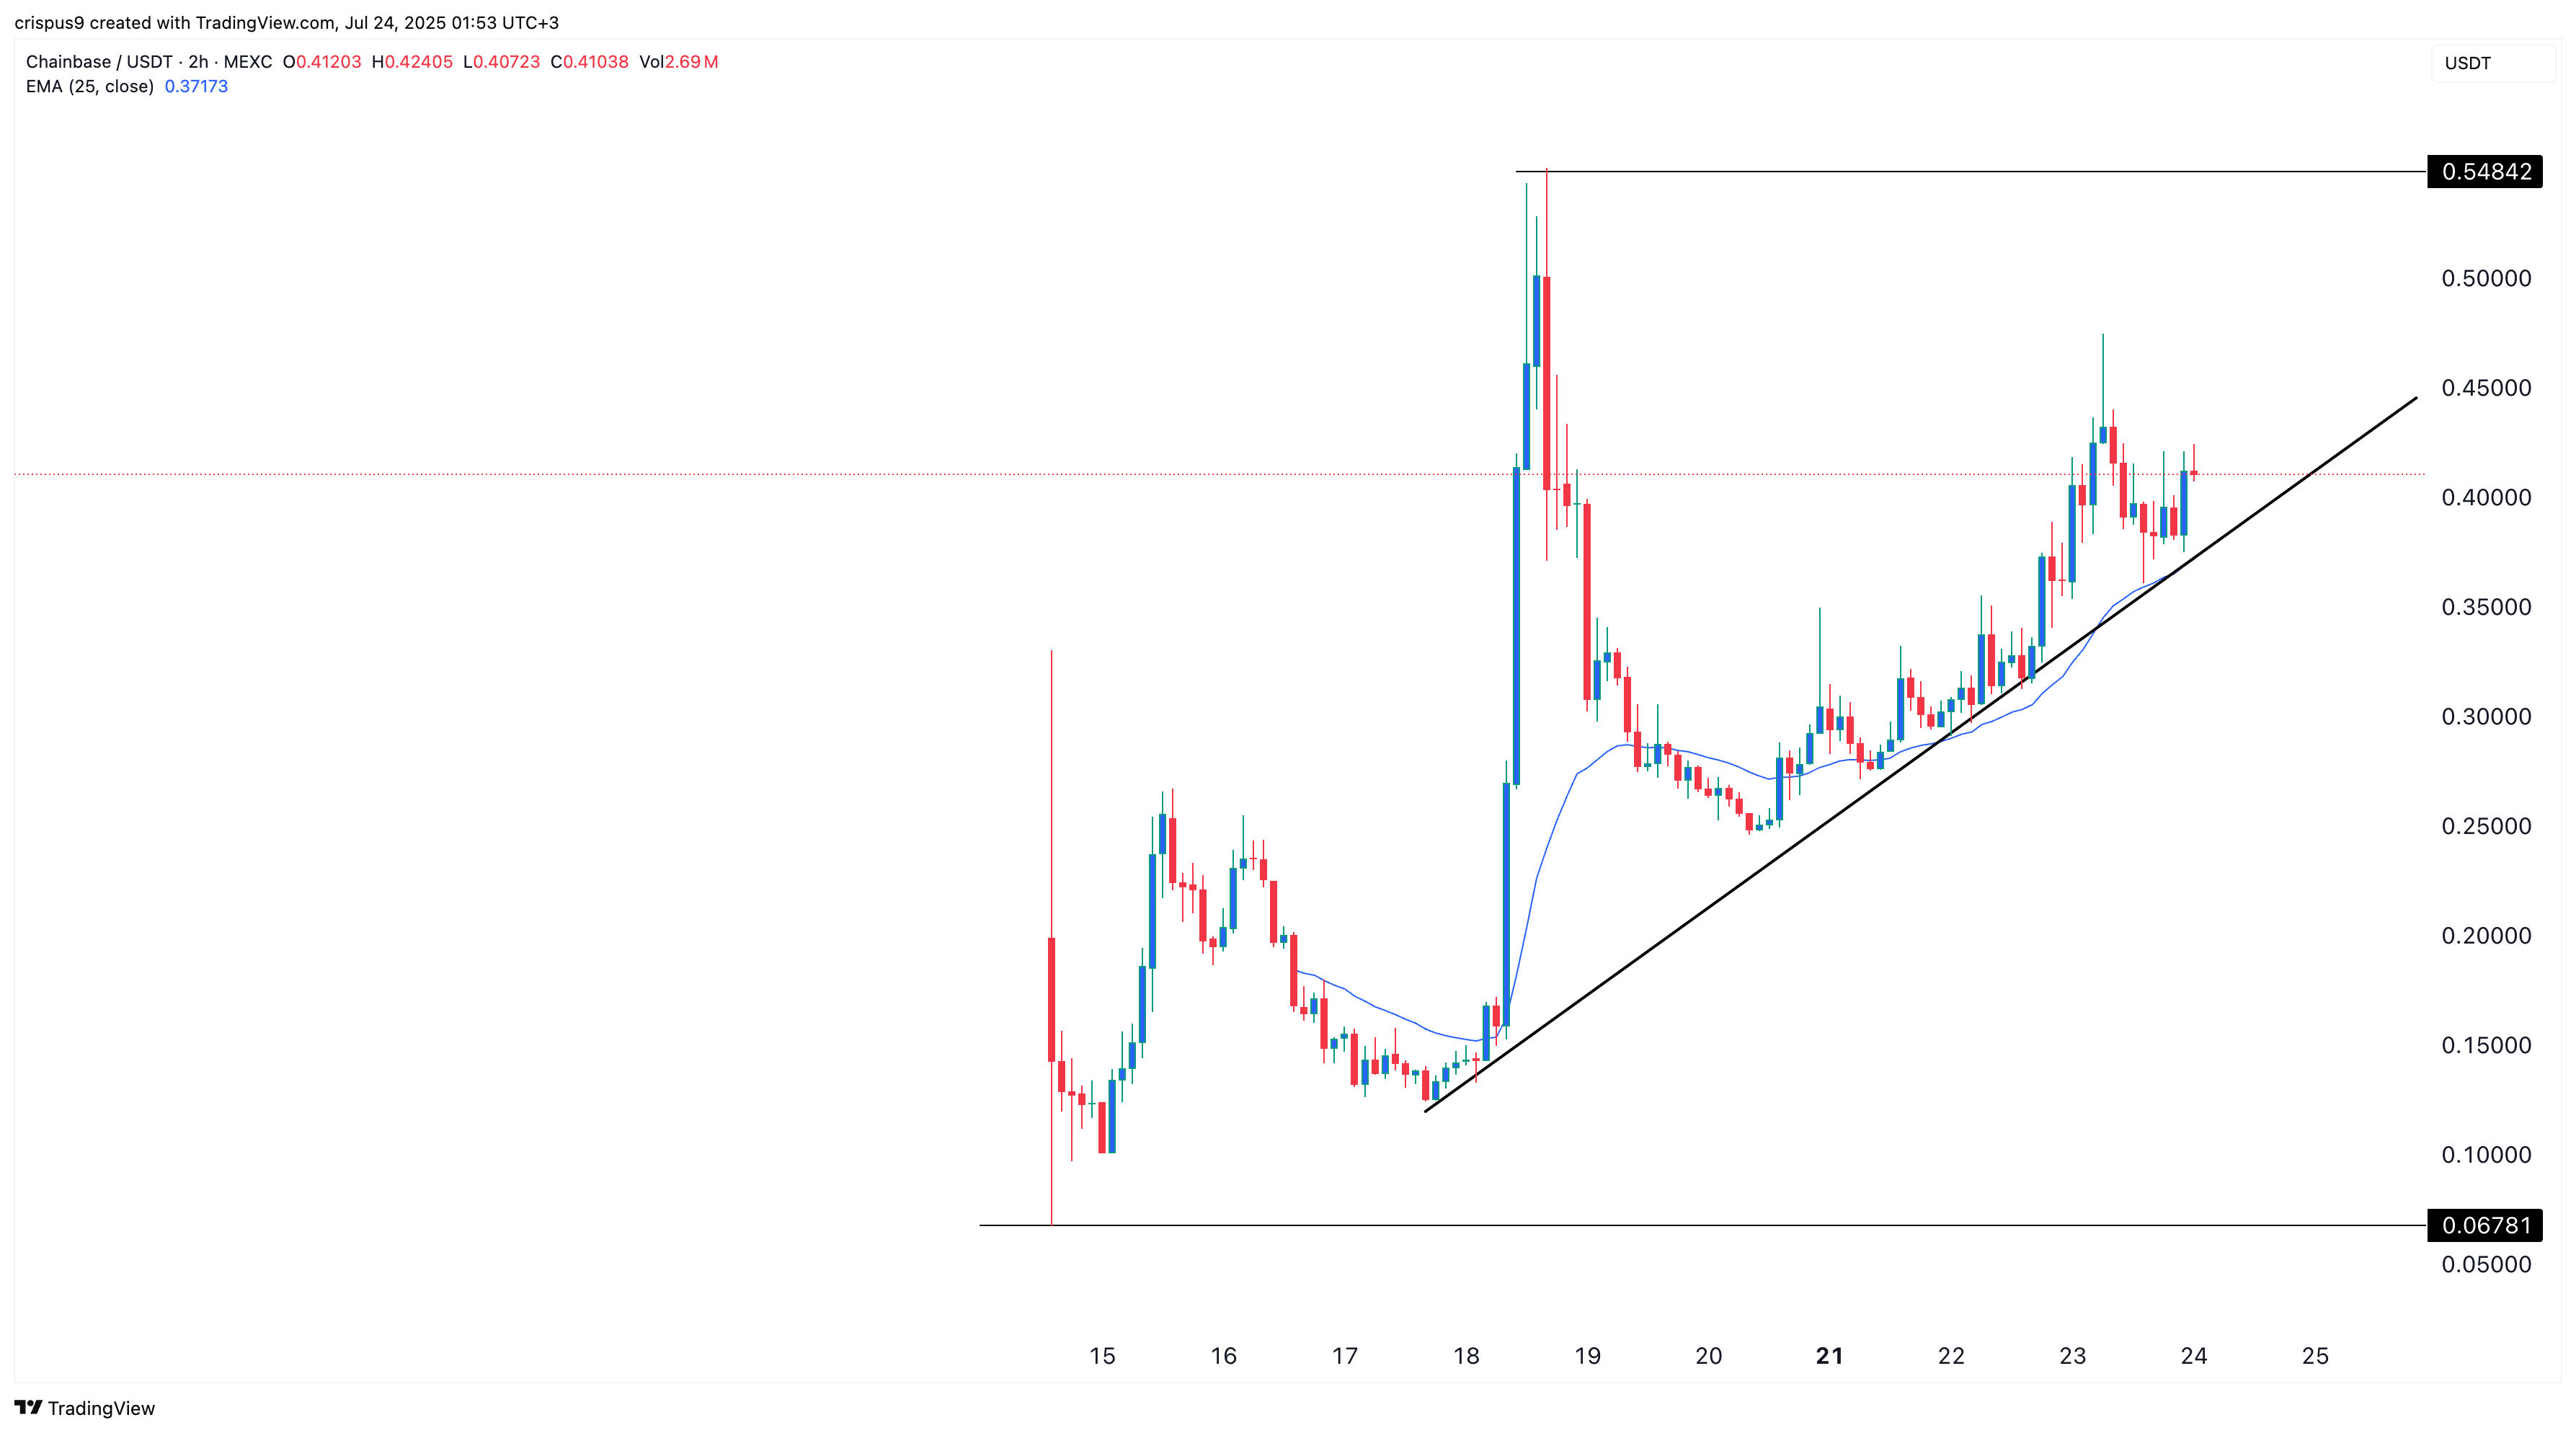
The Chainbase token price has staged a strong comeback in the past few days following its airdrop. It moved from a low of $0.067 on July 14 to a high of $0.400.
C price has moved above the ascending trendline that connects the lowest swing since July 17. This recovery occurred as the network continued to ink partnerships with some of the top players in tech. For example, it recently reached partnerships with TrustLabs and Codotta.
Technical indicators suggest that the Chainbase price may continue rising as bulls target the all-time high of $0.5485, which is approximately 34% above the current level. A drop below the ascending trendline will invalidate the bullish forecast.
READ MORE: Here’s Why Metaplanet Stock Price Has Crashed as Bitcoin Surged