


Dogecoin (DOGE) is sitting in a key buying zone that’s historically sparked big price jumps. Currently, DOGE price is trading around $0.236, down 0.22% in the past 24 hours, but still up more than 43% over the last month.
Analysts on X (formerly Twitter) are calling attention to the meme coin’s price structure, suggesting that a bounce above $0.25 could pave the way for a sharp move toward $0.36.
“DOGE is back in a range that has historically served as a buying zone, triggering major bull runs,” crypto trader Ali Charts noted.
Similarly, Sudelytic highlighted a potential double-bottom formation, suggesting that reclaiming $0.26 as support could bring “serious momentum” with $0.46 as a potential mid-term target.
Dogecoin Price Analysis: Key Levels to Watch
The charts show a narrow gap between important support and resistance levels. Currently, DOGE is hovering above the $0.234 zone, which aligns with the Oblique Major Resistance from previous price action. A break below could see a retest of the Bollinger Average at $0.218.
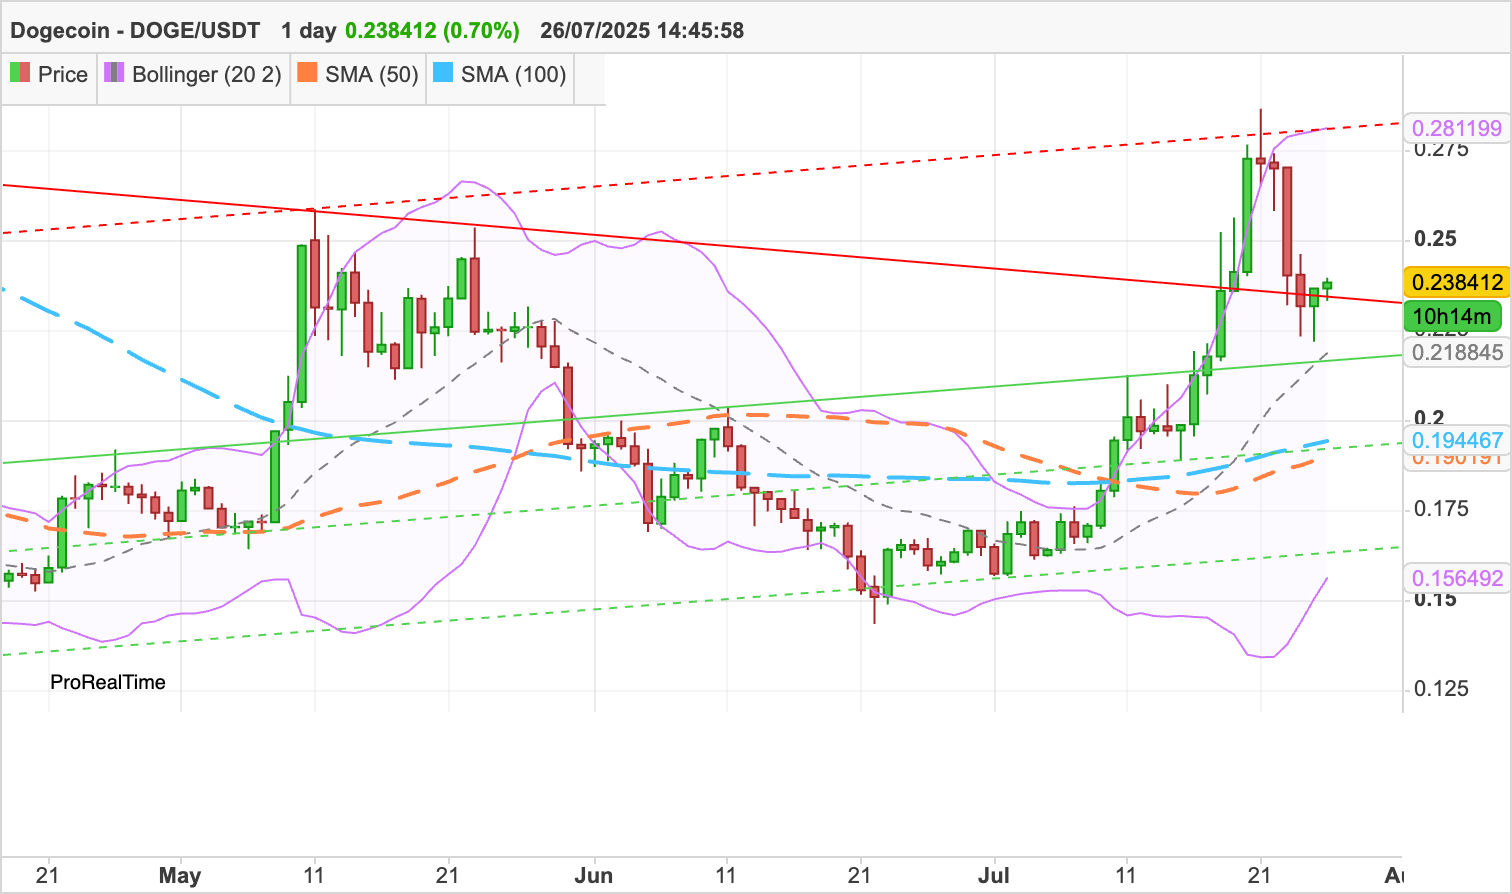
To start, bulls need to turn $0.25 into a level of support. If that happens, this could lead to a rise toward $0.28–$0.30, which is near the upper Bollinger Band area.
If DOGE climbs back to $0.25, there’s little resistance until around $0.36, according to Glassnode data. Right now, it’s still holding above its 50-day and 100-day moving averages, both sitting near $0.19. This shows that it has medium-term bullish momentum.
On a longer timeframe, DOGE is in an ascending channel that has led to several bull runs since 2017. Each time it touches the lower boundary, there have been rallies of 50–200% within one to two weeks.
READ MORE: Bitcoin Cash Jumps 3.8%, Can BCH Break $600 and Hit $662 Next?