


The Pi Coin crypto price has remained relatively stable over the past two months, despite the recent crypto bull run that pushed Bitcoin to a record high and most altcoins up by double digits. The Pi Network token was trading at $0.4420, a few points above the all-time low of $0.40.
Wyckoff Theory Points to a Pi Coin Crypto Price Surge
The daily chart shows that the Pi Network price has remained within a tight range over the past two months. This consolidation could be strategic and a sign of a potential comeback based on the Wyckoff Theory.
Discovered over 90 years ago, the theory identifies four stages that assets go through. The first stage is known as accumulation and is usually characterized by price consolidation, low volume, and selling pressure. The Pi token meets these characteristics, as shown in the chart below.
Fortunately, Pi Network has gone through this stage in the past. As the chart below shows, it went through the accumulation phase between April and early May.
The next stage is known as the markup phase, characterized by a higher volume and a fear of missing out (FOMO) among investors. This FOMO also happened in May after the team teased a major announcement, which ultimately turned out to be the news from Pi Network Ventures.
Therefore, it is likely that the token will have a strong bullish breakout soon as it moves from the accumulation to the markup. If this happens, the next point to watch will be the psychological point at $1.
READ MORE: HBAR Price Prediction: Eyes 45% Surge as Hedera Metrics Surges
Pi Network Has Formed Bullish Chart Patterns
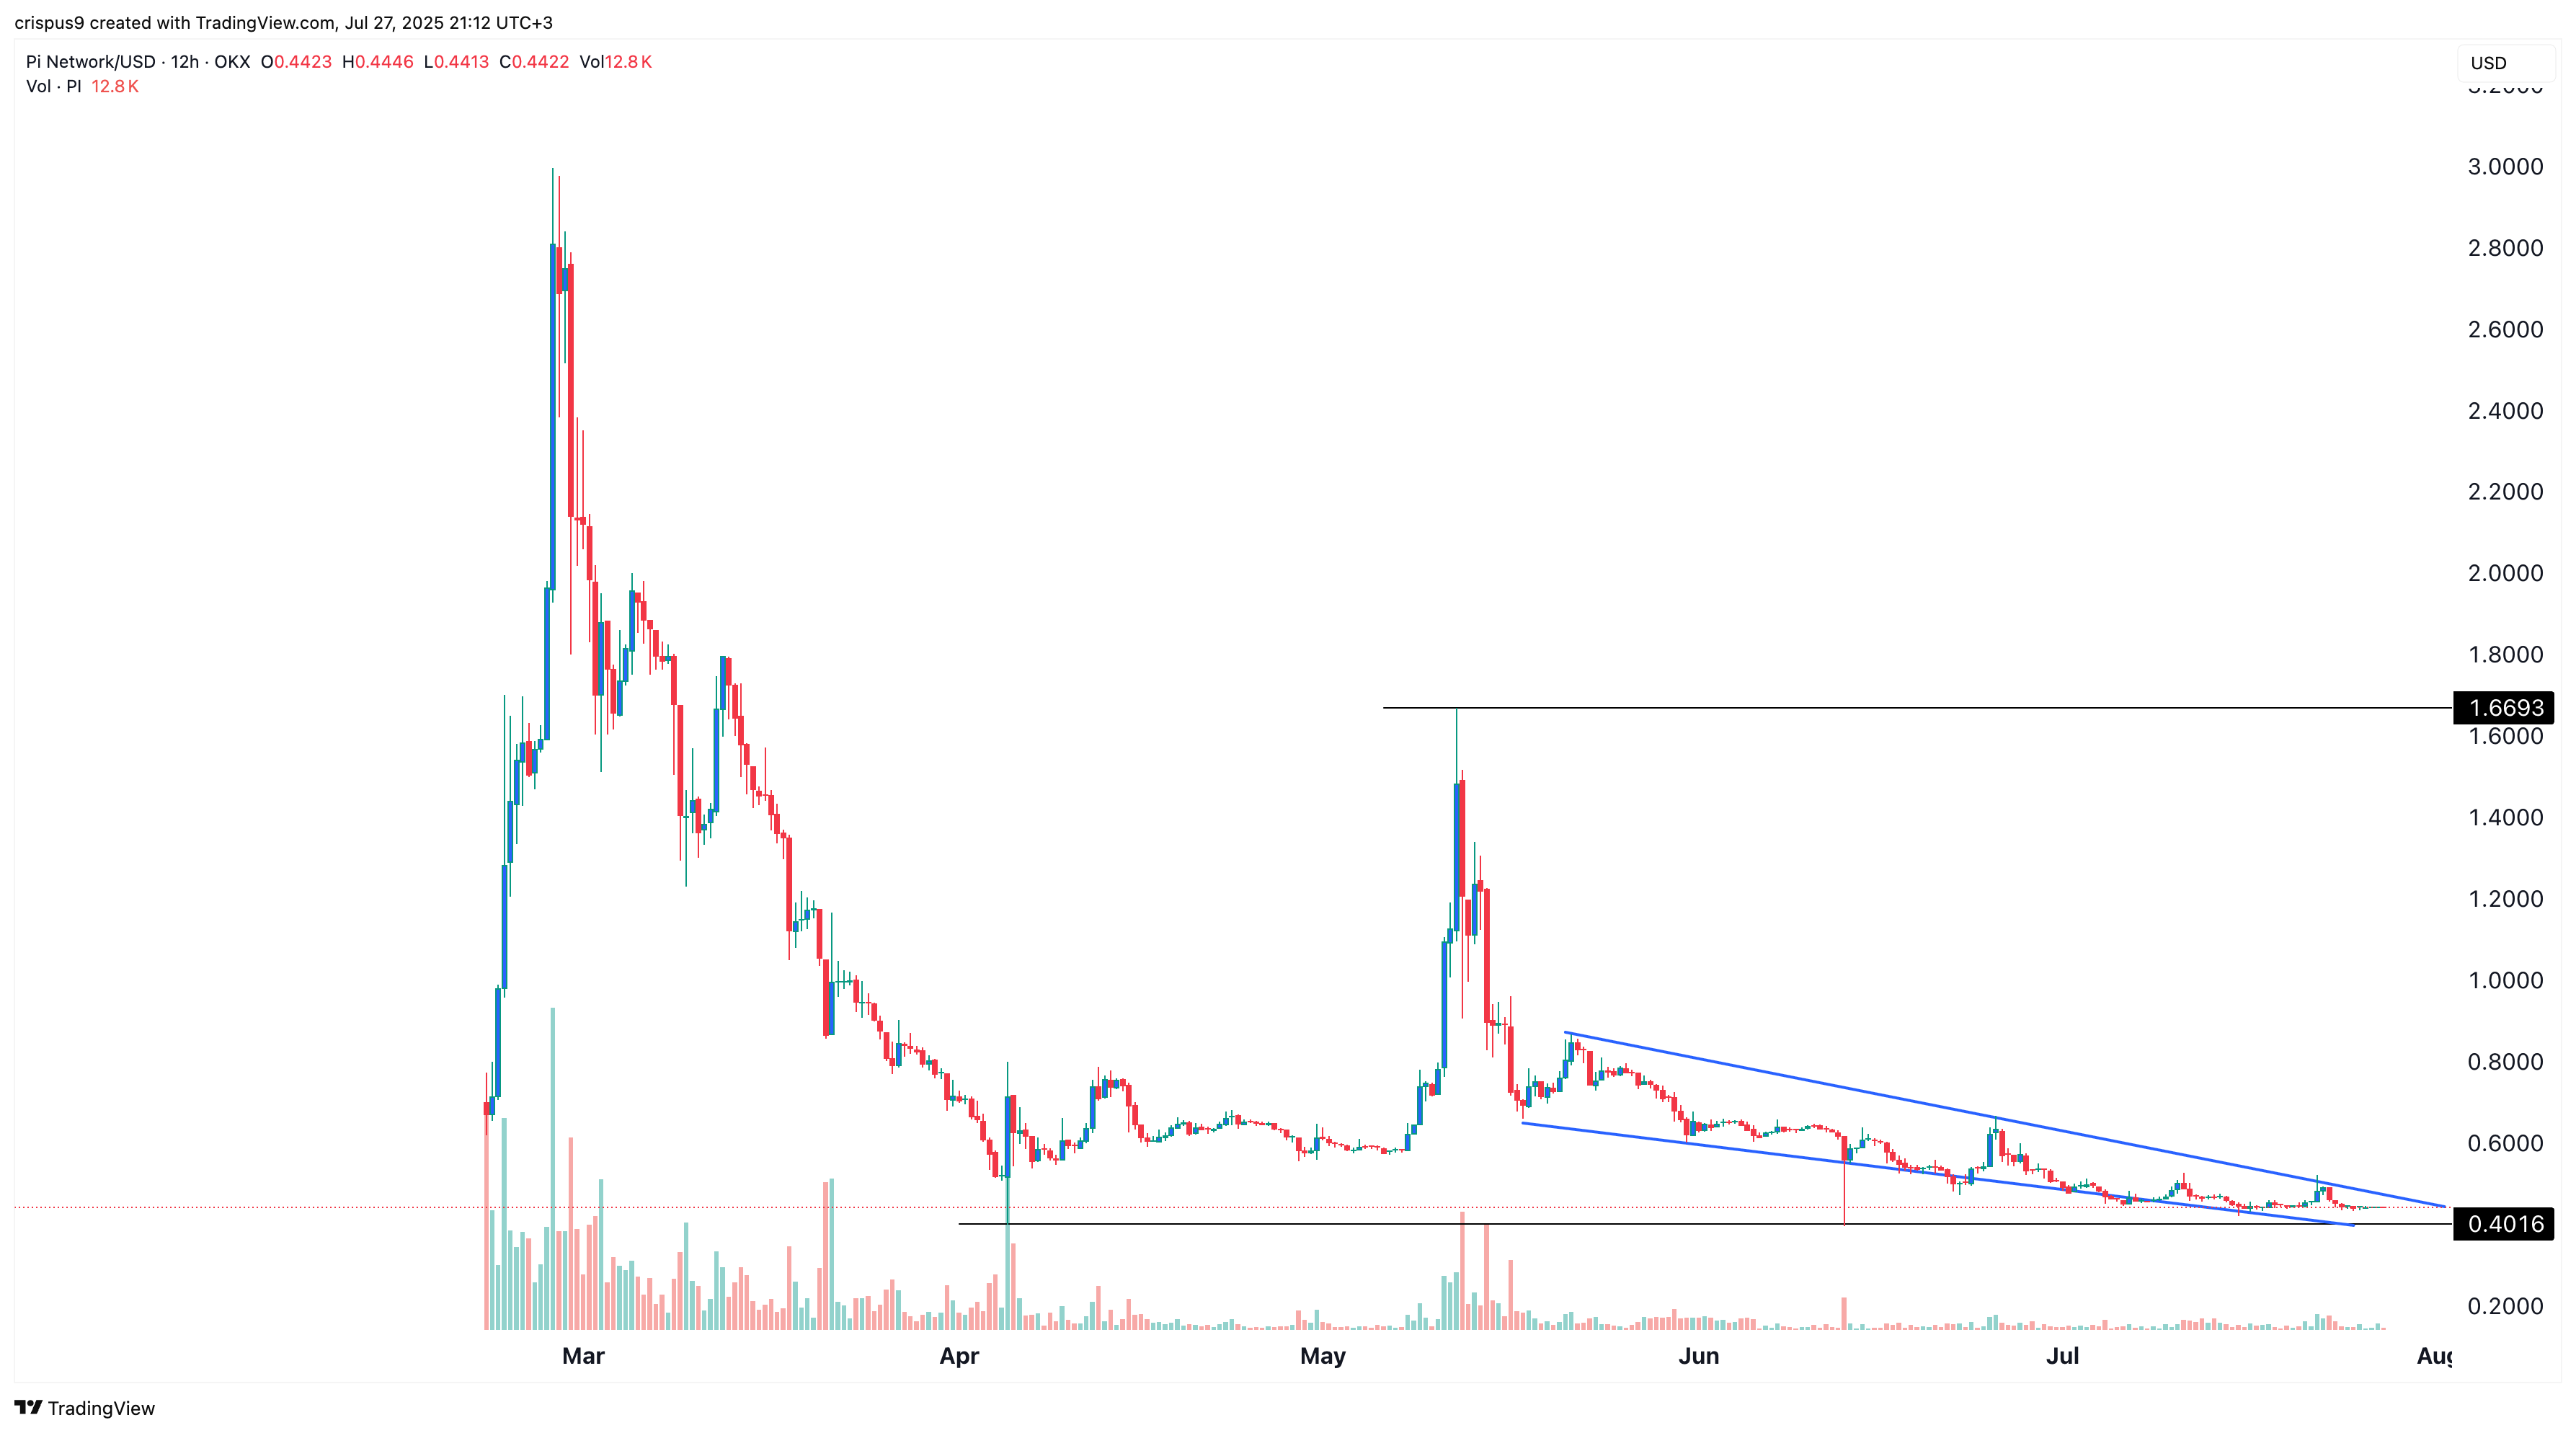
The bullish case for the Pi Network price is also based on its strong technicals. It formed a giant double-bottom pattern at $0.4015, its lowest swing on April 5 and on June 6.
A double bottom is characterized by two distinct levels and a neckline, which in this case is at $1.6693, its highest swing on May 12. A double-bottom is one of the most bullish reversal patterns in technical analysis.
Most notably, the token has formed a falling wedge pattern, as shown in blue in the chart above. This pattern consists of two descending and converging trendlines, with a bullish breakout occurring as the two lines approach their convergence point.
At the same time, as happened in May, the spread of the three lines of the Bollinger Bands has narrowed. That is a sign that the token will likely undergo a short squeeze, potentially reaching $1, followed by the double bottom’s neckline at $ 1.60.
READ MORE: Here’s Why Altcoins Like Sui, Cronos, PENGU, PUMP are Going Up