


Sei price has crashed into a bear market as it plunged by over 24% from its highest point in July. It plunged to a low of $0.2950 on Thursday, its lowest level since July 10. It remains 60% below the highest level since 2024.
Why the Sei Price Has Plunged
Sei price has continued its strong downward trend over the past two weeks, as its stablecoin and decentralized finance (DeFi) ecosystem has deteriorated.
Data shows that Sei’s total value locked (TVL) plunged to a low of $613 million, down from the year-to-date high of $771 million.
The ongoing decline has been led by Yei Finance, whose assets have tumbled by 30% in the last 30 days to $254 million. Sailor’s assets have dropped by 7%, while SiloStake plunged by 21%. The only gainer in this period was Takara Lend, whose assets jumped by 44%.
READ MORE: XLM and XRP Price Prediction: Will Ripple, Stellar Rally in August?
More data shows that the supply of stablecoins in the network has plunged even after the recent signing of the GENIUS Act in the United States. There are now $204 million worth of stablecoins in Sei, a $35 million decline in the last seven days.
USDC has a dominance of 79% with $162 million in assets, while Tether (USDT) and Avalon USDa have $26.7 million and $7.2 million, respectively. A falling stablecoin supply in a blockchain is a sign that activity in the network is deteriorating.
The only positive metric on Sei is that its gaming market share continues to grow. DappRadar data shows that the unique active wallets (UAW) jumped by over 30% in the last 30 days to 11.76 million, making it the industry leader. It is followed by opBNB, SKALE, and Ronin.
Sei Token Price Technical Analysis
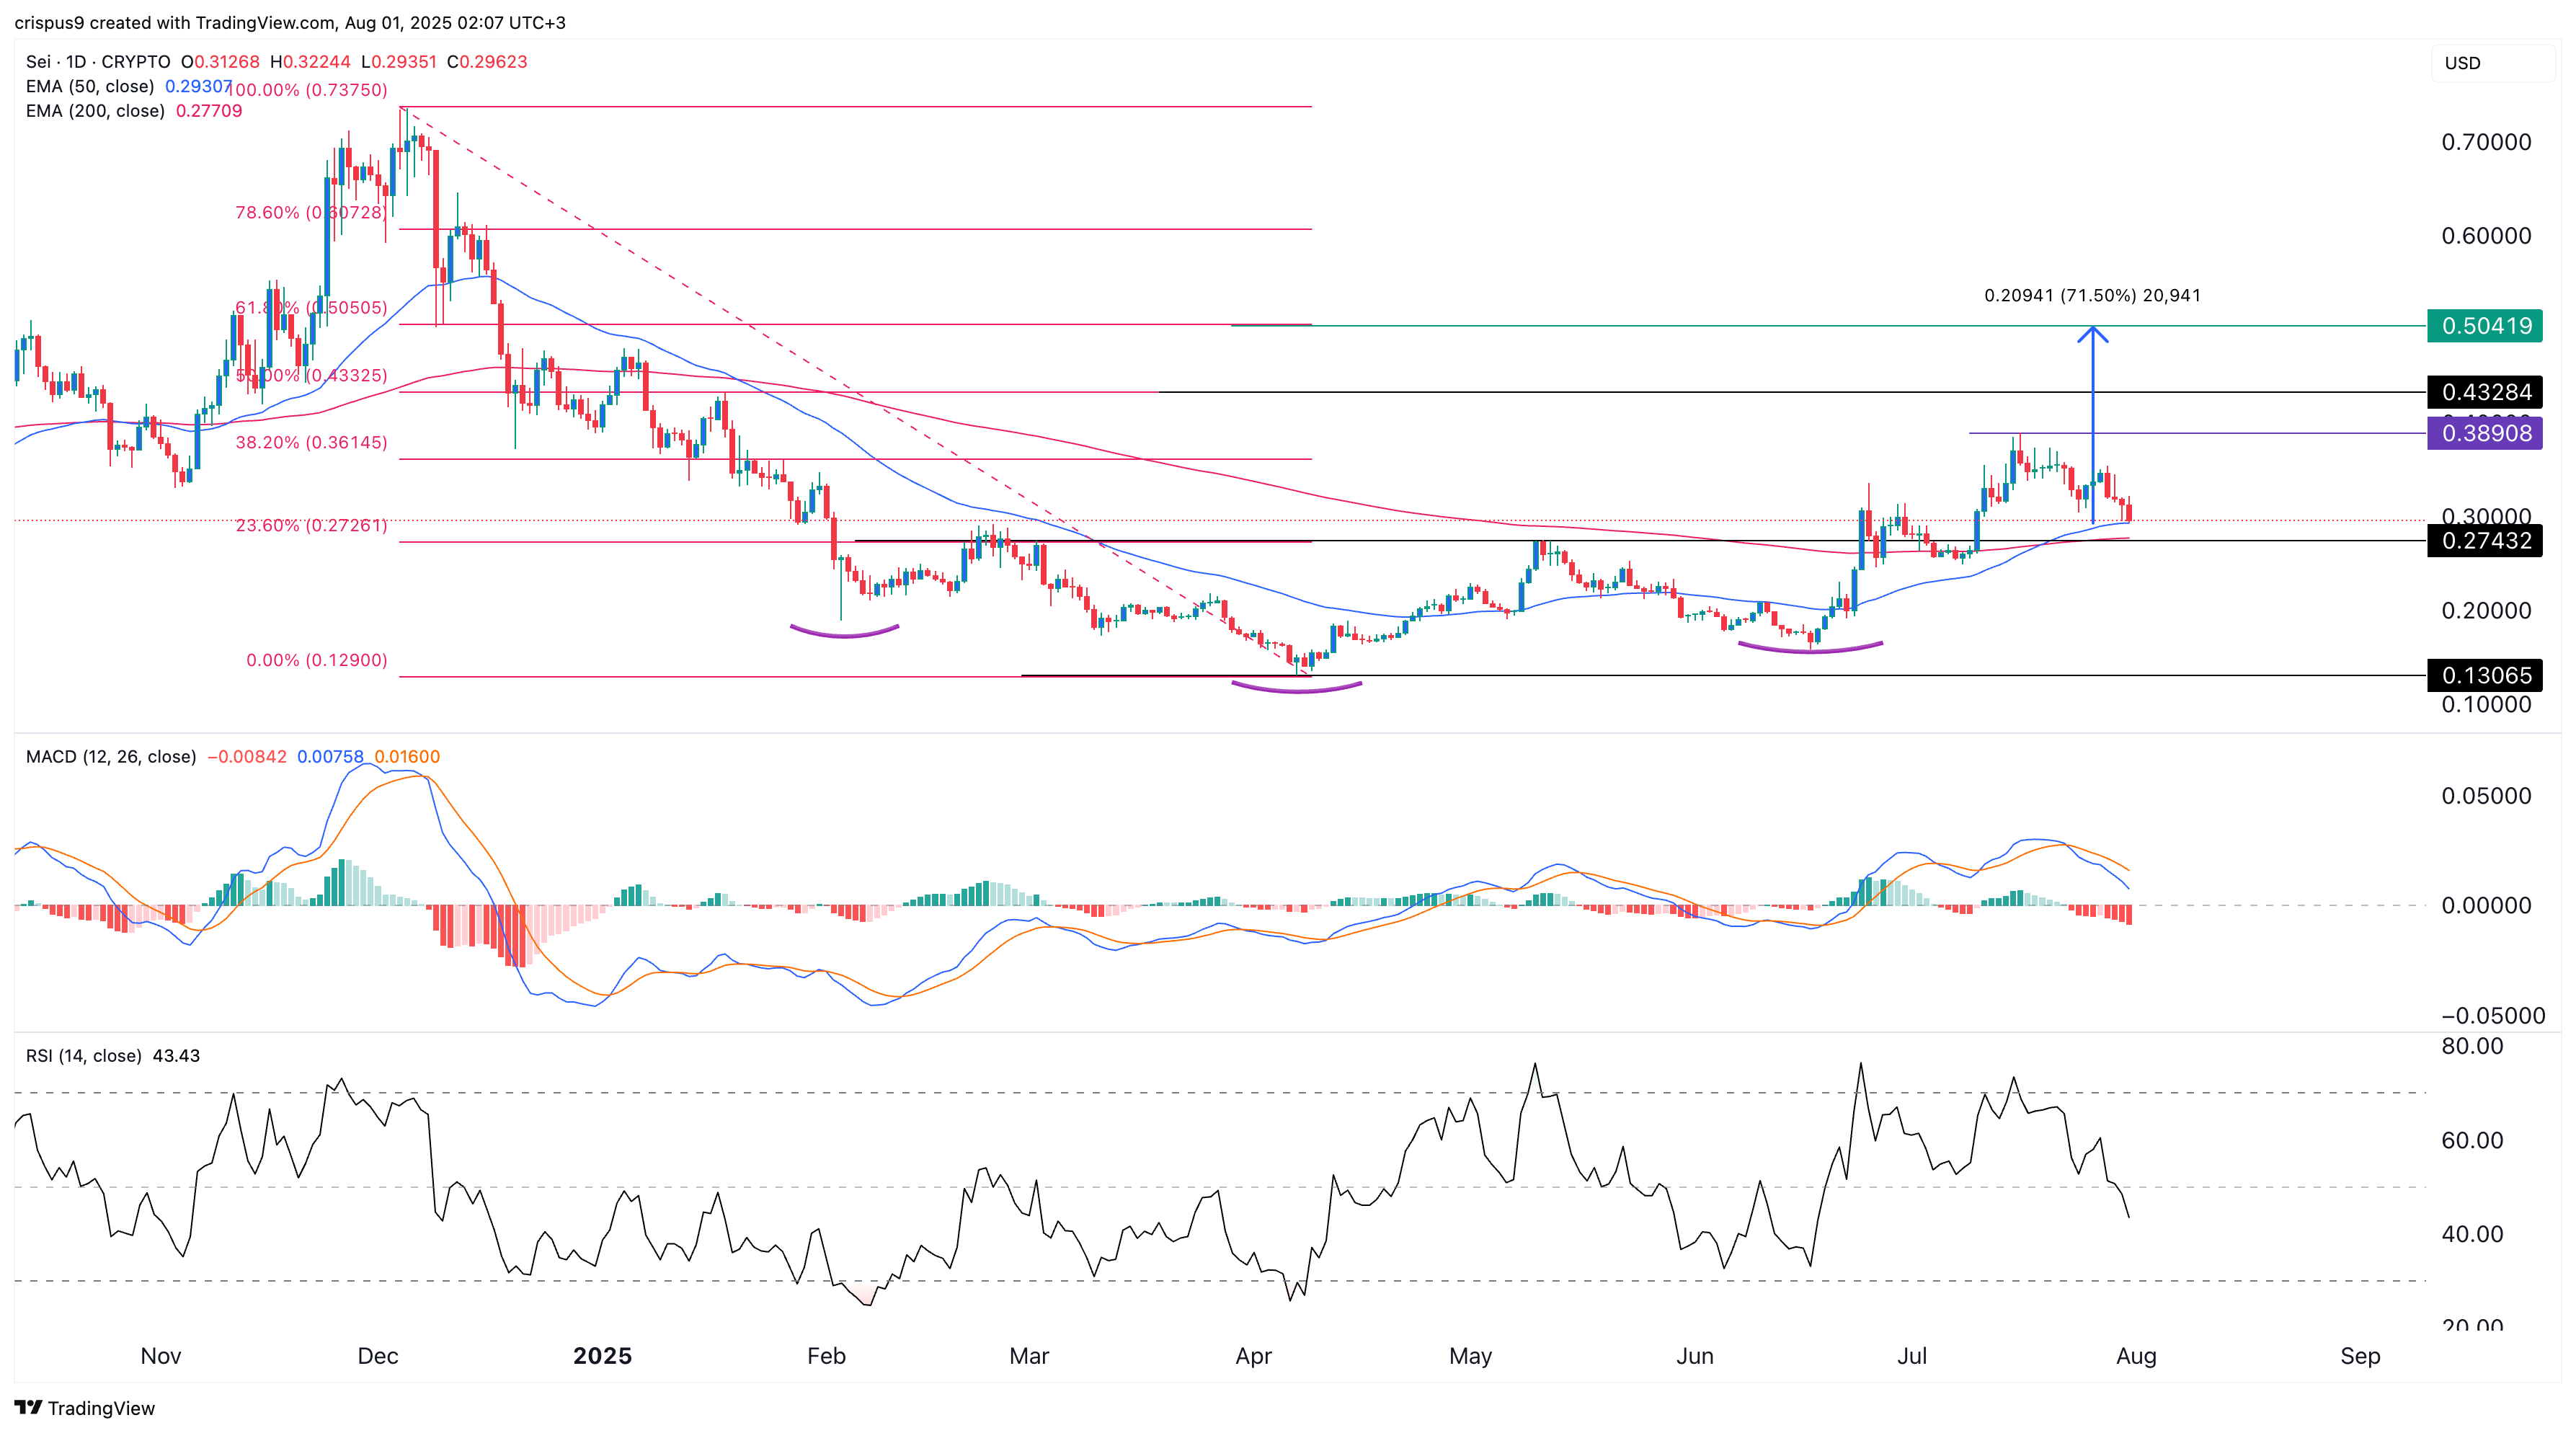
The daily chart shows that the Sei price bottomed at $0.1300 in April and then rebounded to a high of $0.3890 in July. It formed an inverse head-and-shoulders pattern, a popular bullish continuation sign.
SEI price also formed a golden cross pattern as the 50-day and 200-day Exponential Moving Averages (EMA). However, the token has pulled back and settled on these averages recently.
The Relative Strength Index (RSI) has moved below the neutral point at 50. Also, the MACD indicator has continued to point downwards, and the two lines are about to cross the zero line.
Therefore, the Sei price will likely fall, retest the support at $0.2743, and then resume the uptrend. This is known as a break-and-retest pattern, a common continuation sign.
A rebound could push the Sei price to the 61.8% Fibonacci Retracement level at $0.5041, up by 70% from the current level.
READ MORE: JASMY Price Prediction as Whale Accumulation Jumps 188% in July