


IOTA price has crashed below the 50-day moving average, even as its network makes some modest improvements. It dropped to a low of $0.1822 today, August 6, down by 30% from its highest point in July.
IOTA Key Metrics are Doing Well
Third-party data shows that IOTA is making some improvements after the recent Rebased upgrade. For example, Nansen data reveals that it was the third-fastest-growing chain in the crypto industry after Starknet and Ronin.
Its transactions jumped by 154% in the last 30 days to 871,579. While this number is tiny compared to some other blockchains, it is a step in the right direction.
Another key metric is that IOTA’s total value locked in the decentralized finance (DeFi) industry has jumped by 200% in the last 30 days to $30.5 million.
Swirl, the biggest player in the network, has over $14 million in assets, while Pools Finance and Virtue have $9.37 million and $6.41 million, respectively.
READ MORE: SPK Crypto Price Prediction: How High Can Spark Get?
Additionally, more investors are staking IOTA tokens to take advantage of its 13.6% staking yield, which is higher than that of other cryptocurrencies like Ethereum and Solana. Over $398 million worth of IOTA tokens have been staked.
These developments have been enabled by the recent Rebased upgrade that made IOTA one of the top competitors to popular chains like Ethereum and Solana. It introduced move-based smart contracts, superior speeds, and full decentralization.
Its biggest challenge is that the layer-1 industry has become highly competitive. Ethereum maintains a commanding market share, while layer-1 networks like BSC and Solana are gaining market share.
IOTA Price Technical Analysis
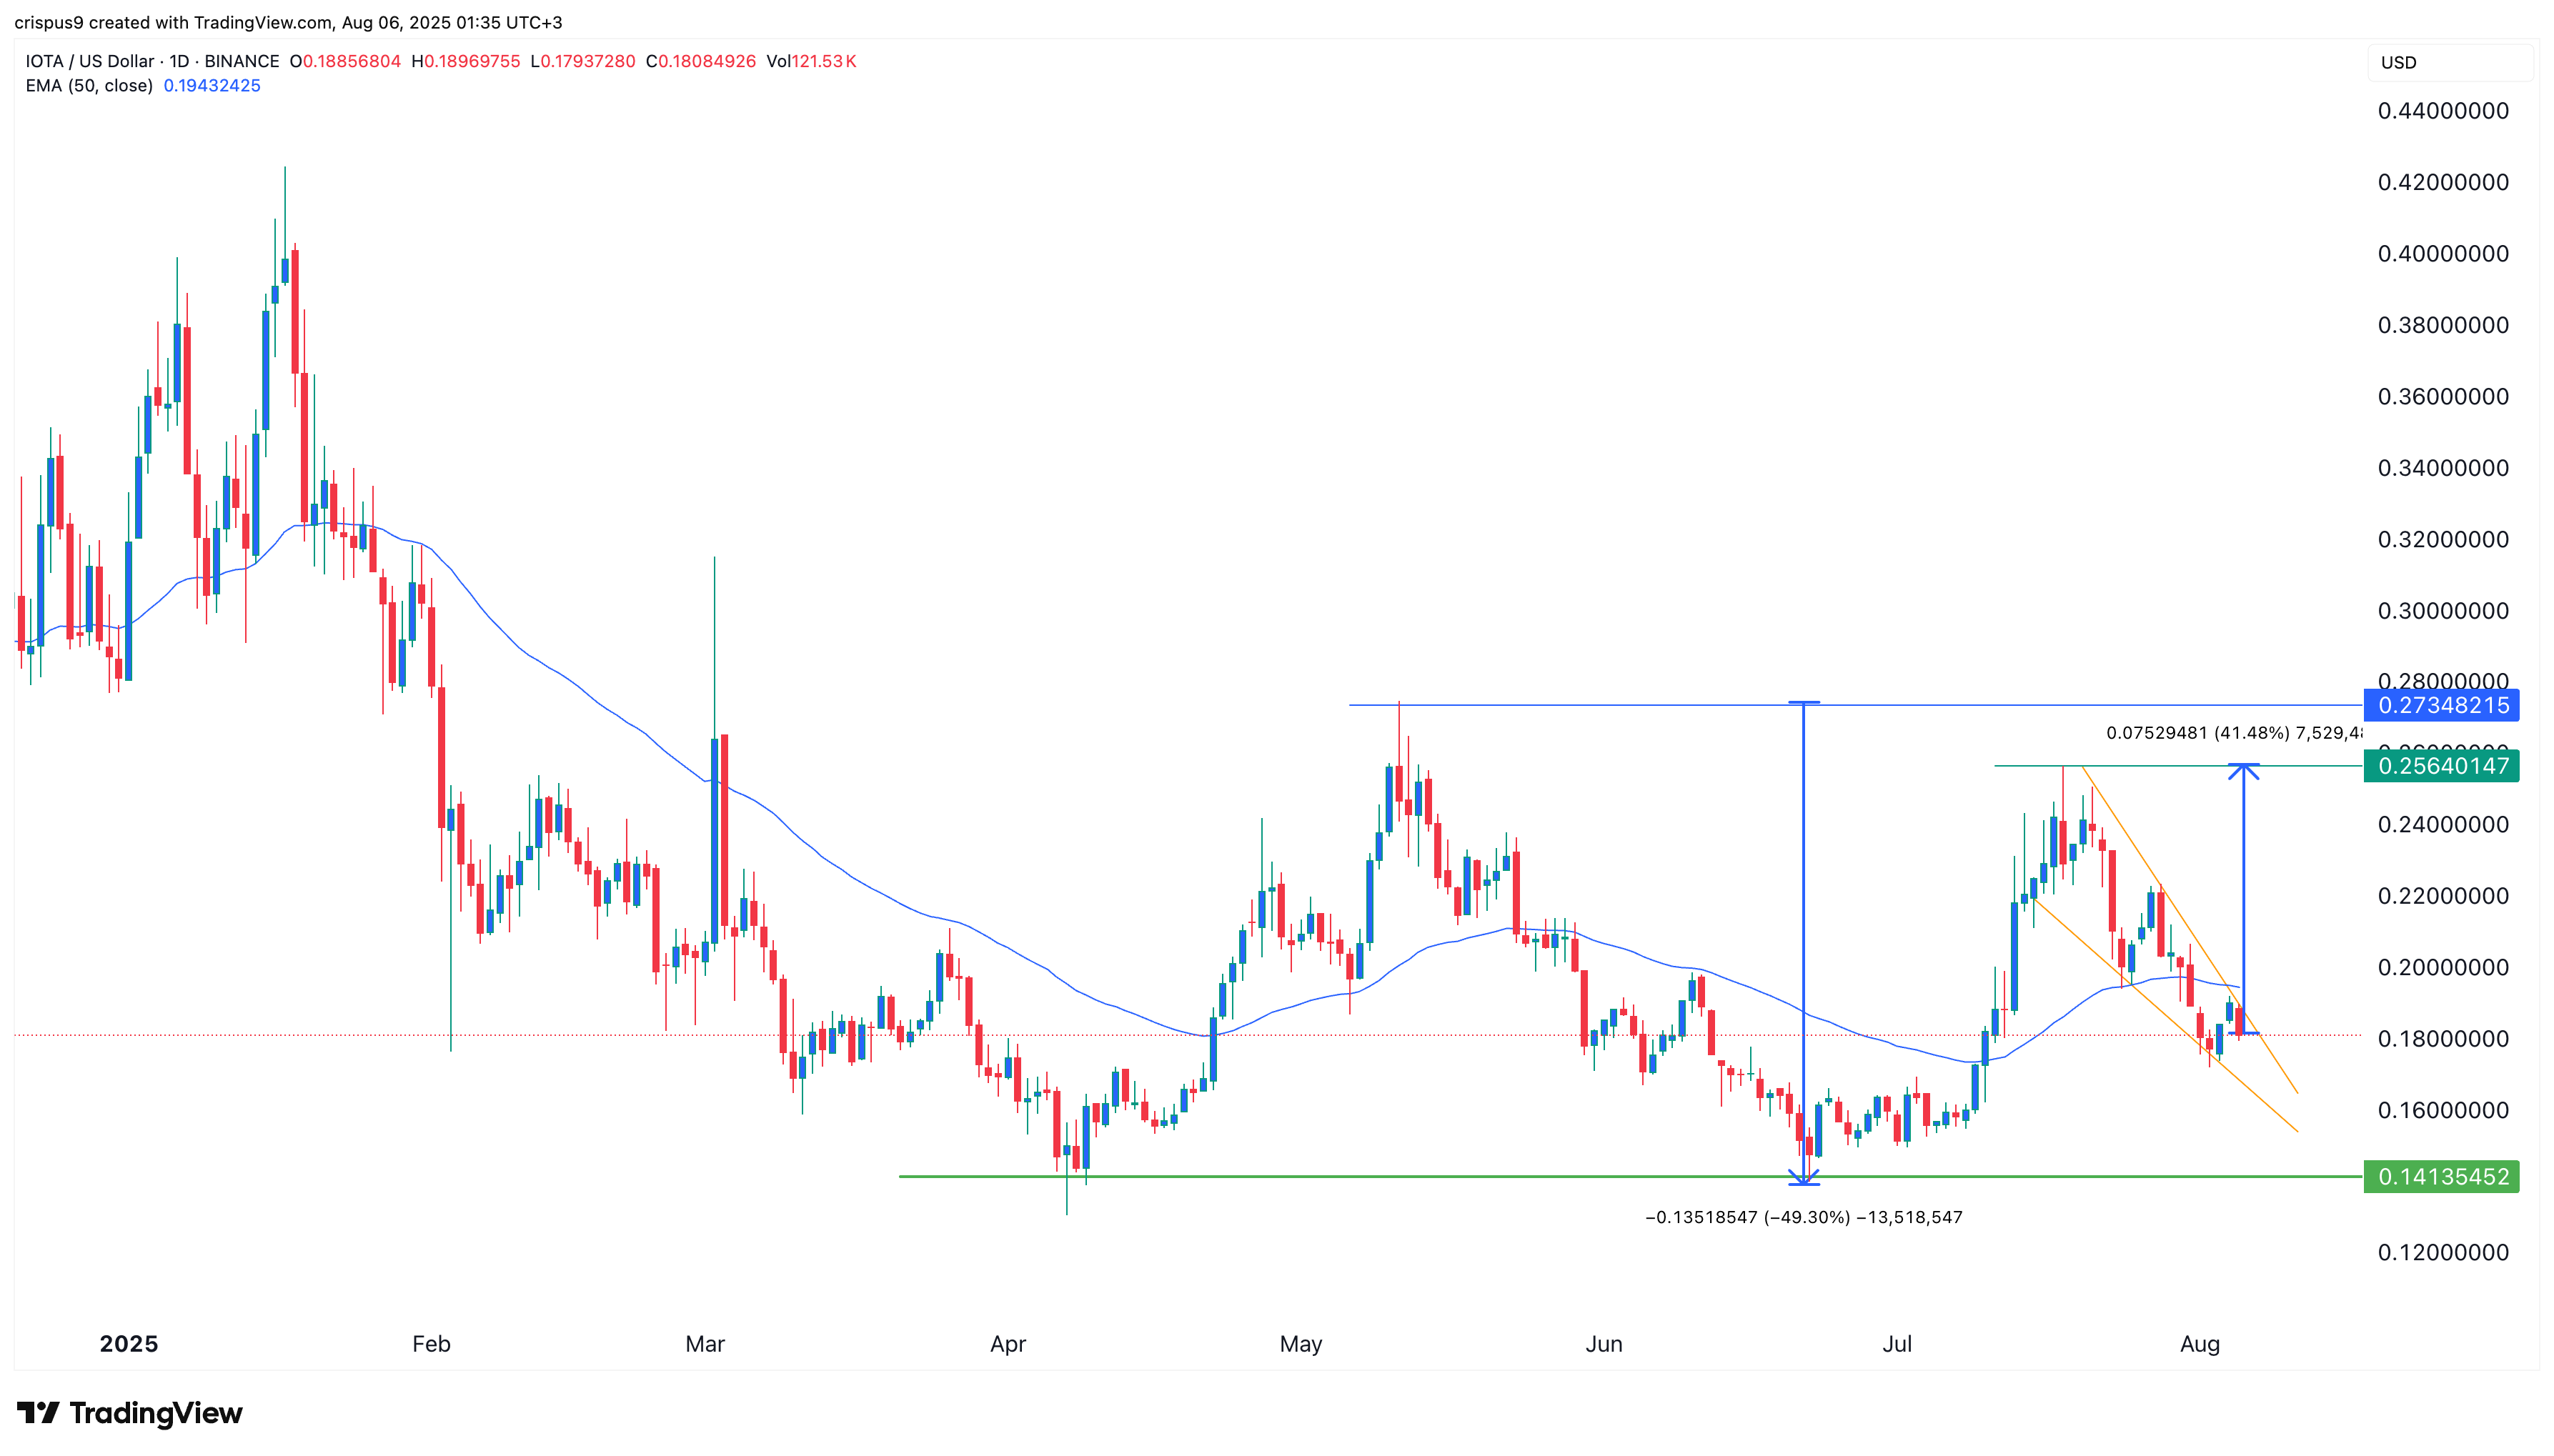
The daily chart shows that the IOTA token price bottomed at $0.1415 in April, then rebounded to $0.2734 in May. It then dropped again to $0.1415 in June, forming the highly bullish double-bottom pattern whose depth was about 50%.
IOTA price has now moved slightly below the 50-day moving average, which is a bearish sign. On the positive side, the token has formed a falling wedge pattern, which happens when two descending trendlines converge.
Therefore, the double bottom and falling wedge patterns point to an eventual rebound in the coming days. If this happens, the next level to watch will be at $0.2565, its highest point in July, which is about 42% above the current level.
READ MORE: MSTR Stock Stumbles: Is 160% Yielding MSTY ETF the Smarter Buy?