


XRP price pulled back slightly for three consecutive days after BlackRock ruled out filing for a Ripple ETF. It pulled back to $3.18 on Monday morning, down from last week’s high of $3.4. This article explains why the XRP token will rally despite the BlackRock news.
XRP Price to Rally Despite BlackRock News
The XRP price jumped last week after speculation that BlackRock would apply for a spot ETF, as BanklessTimes had predicted in a recent article. However, in a statement to The Block, the company ruled out filing for the fund.
In our recent note, we wrote that a BlackRock XRP ETF made sense because it is the third-biggest token in the crypto industry. XRP now has a market capitalization of over $189 billion.
Also, BlackRock has had a lot of success with Bitcoin and Ethereum funds, which now hold over $96 billion in assets under management (AUM). These ETFs have been highly profitable, with IBIT leading all of its funds.
The other reason is that XRP ETFs have had considerable success so far. For example, the Teucrium XRP ETF (XXRP) has accumulated over $468 million in assets. Similarly, the ProShares UXRP ETF has crossed the $100 million milestone in less than a month.
Still, the XRP price has more catalysts that may push it higher in the long term. First, there are at least ten XRP ETF applications with the Securities and Exchange Commission (SEC). Some of the most notable ones are Invesco and Franklin Templeton. Odds of these approvals have jumped sharply in the past few months.
Second, Ripple Labs is becoming a major player in the stablecoin industry, with Ripple USD (RLUSD) stablecoin having over $642 million in assets. It has become highly successful as it closes the gap with PayPal’s PYUSD stablecoin.
Third, Ripple is working to boost its market share in the payment industry, where it hopes to be a major challenger to SWIFT Network. Such a move would lead to more utility for the XRP Ledger Network.
Ripple Price Technical Analysis
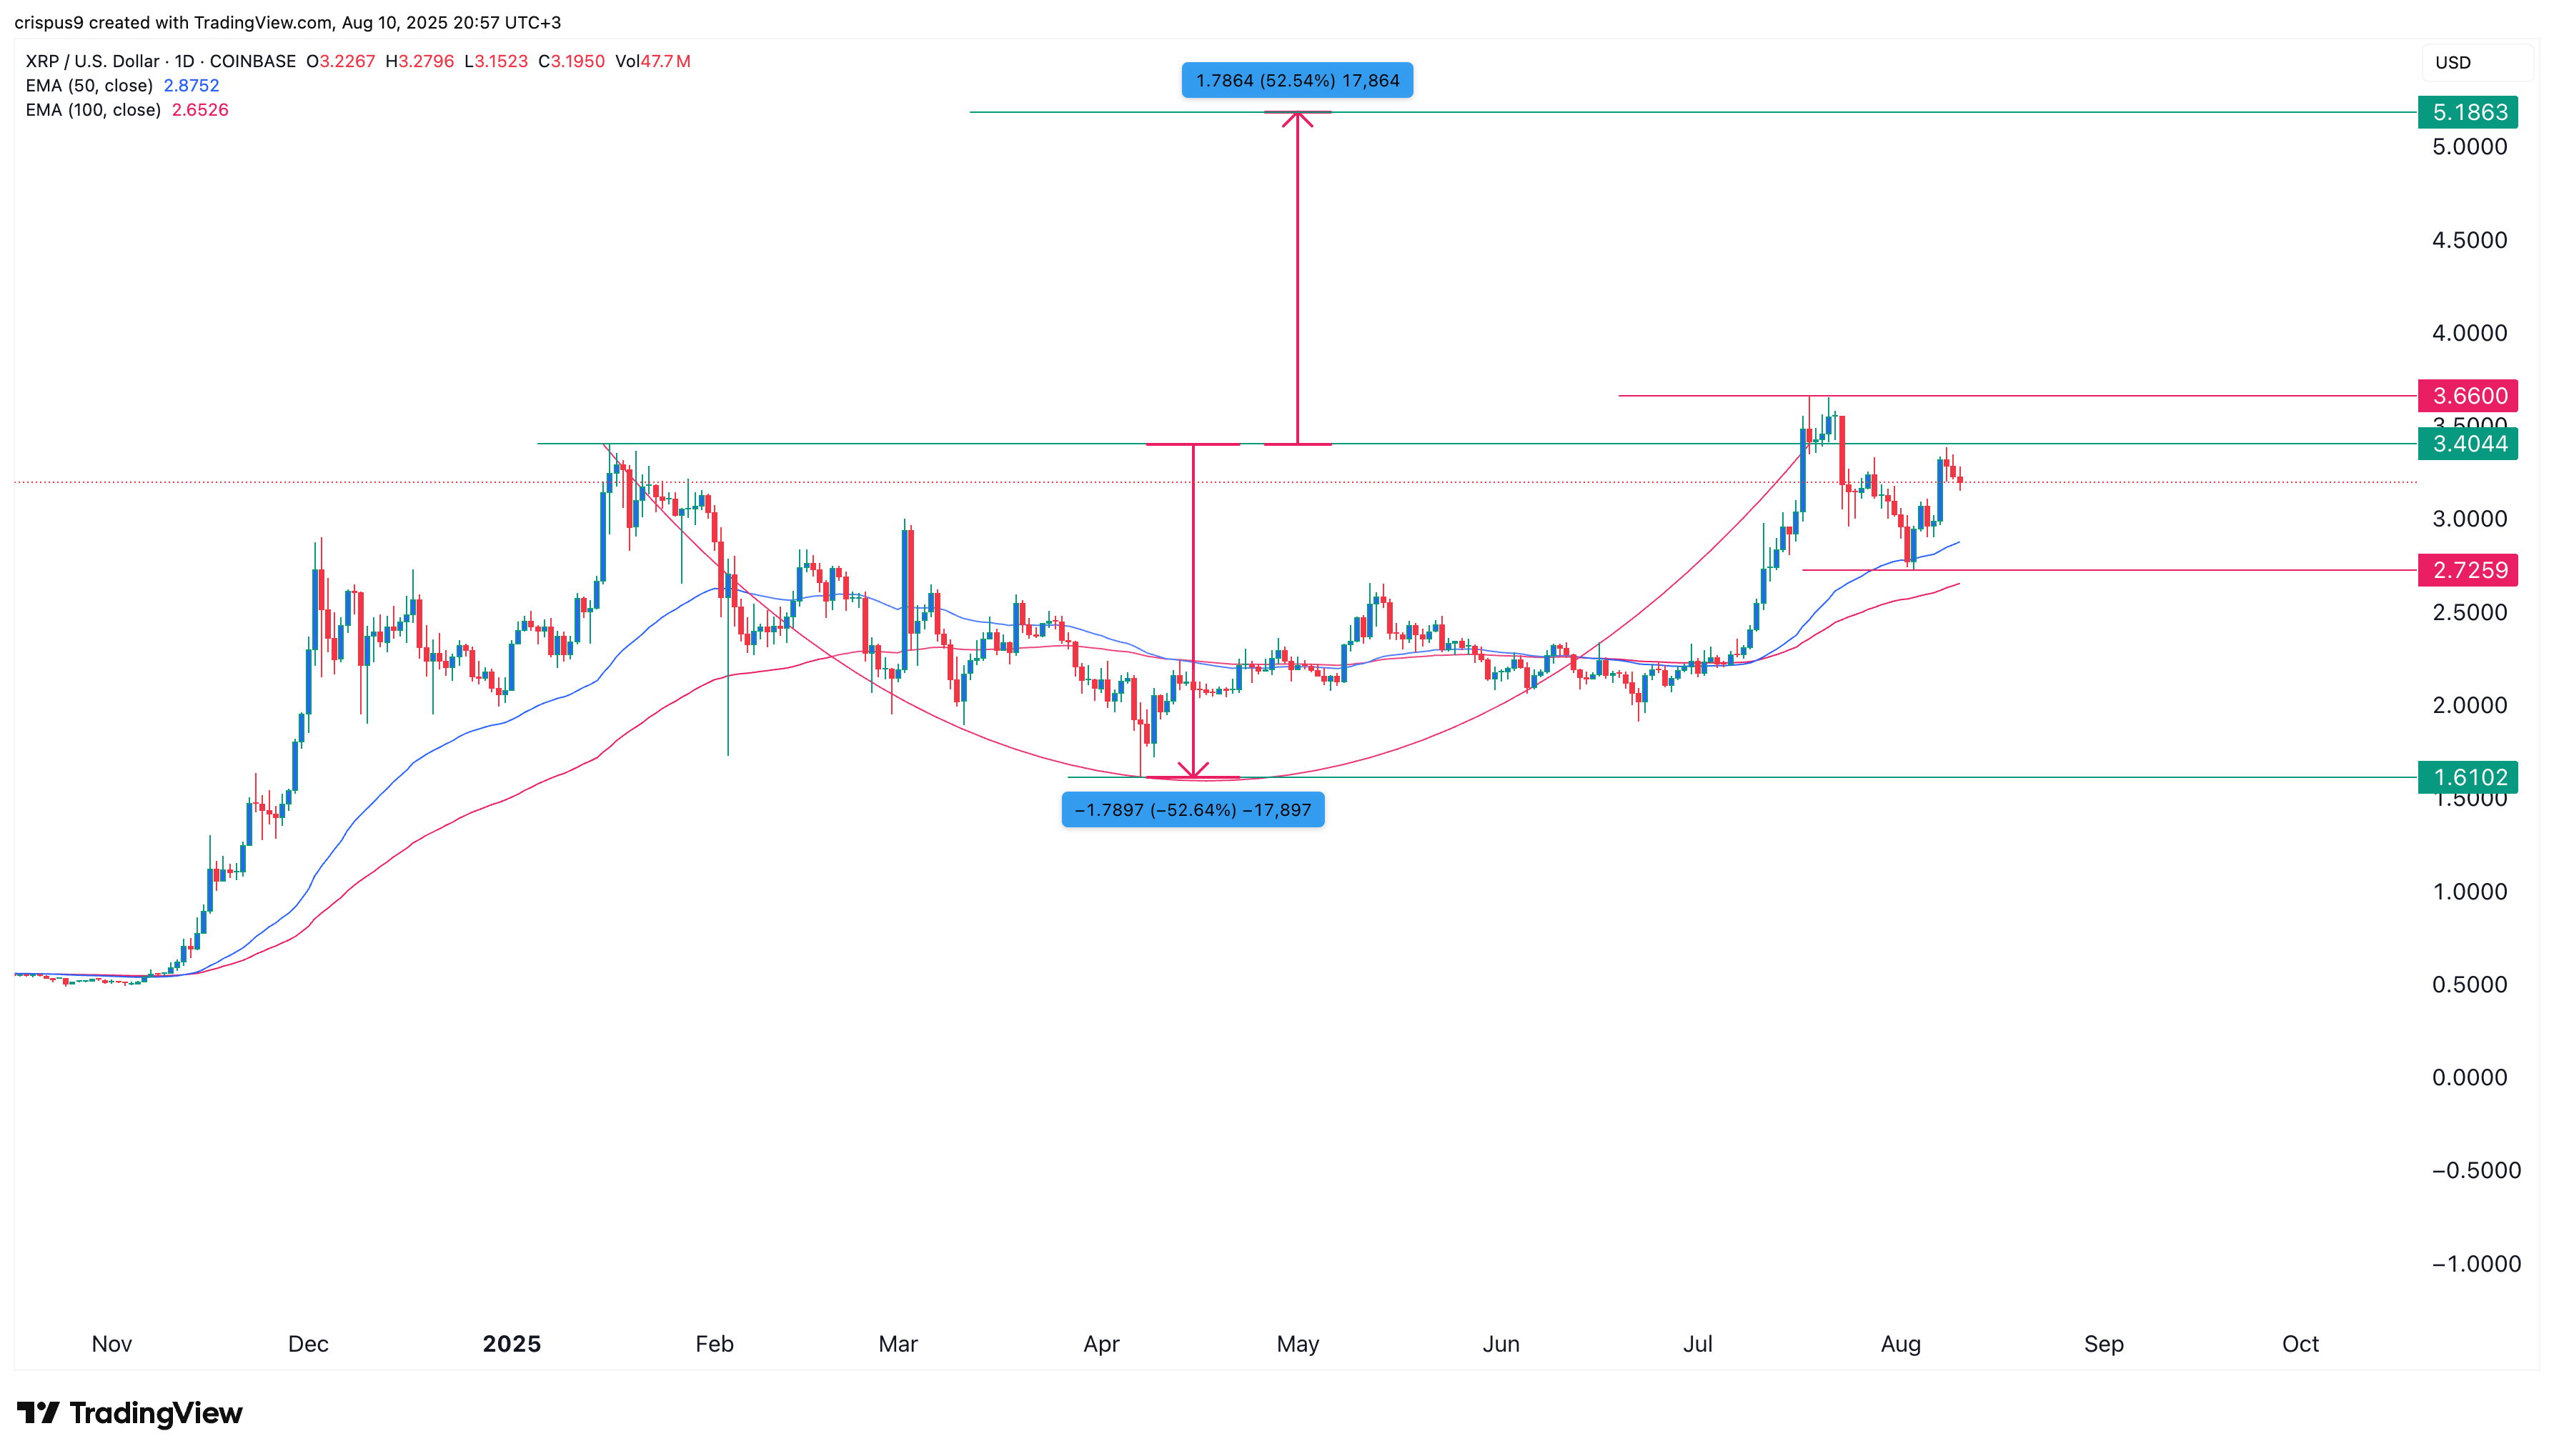
The other bullish catalyst for the XRP price is that it has staged a strong run in the past few months. It has jumped from a low of $1.6100 in April to a peak of $3.66 earlier this month.
Most importantly, the token’s rally is being supported by the 50-day and 100-day Exponential Moving Averages (EMA). Also, the token has formed a highly bullish cup-and-handle pattern, which often leads to more upside.
As we have written before, the C&H has a depth of this pattern is about 52%, giving it a target of $5.2.