


Shiba Inu coin price remains in a deep slumber as demand in the spot and derivative markets falls, and the Shibarium network loses traction among developers and investors. SHIB was trading at $0.00001255, within a range it has maintained for the past few weeks, and significantly lower than its year-to-date high.
Shiba Inu Coin Price Remains Under Pressure
SHIB has evolved from being one of the most popular cryptocurrencies into a fallen angel with little demand. CoinGecko data shows that the token’s 24-hour volume was $144 million, much lower than Dogecoin’s $1.75 billion and Pepe’s $381 million. Other smaller meme coins, such as Pudgy Penguins, Bonk, and Pump, had a higher volume.
The derivatives market also shows that the demand has waned in the past few months. CoinGlass data shows that the open interest in the futures market has slumped in the past few months, moving from a high of $560 million earlier this year to $186 million. This open interest is much lower than that of other, less popular coins, including ApeCoin, which had $203 million.
Shiba Inu’s biggest project has also imploded, with the total value locked (TVL) in the Shibarium network standing at $1.5 million. ShibaSwap, the network’s biggest decentralized finance platform, has only $1 million in assets.
READ MORE: Winklevoss Twins’ Gemini IPO is Coming: Will GEM Stock be a Buy?
Shiba Inu’s token burn mechanism is also having a minimal impact on the price. Data shows that the token burn rose by 537% on Wednesday. While this is impressive, the amount of incinerated tokens was just 454,775, which is equivalent to less than $5.
Meanwhile, whales have given up on Shiba Inu as they slashed their holdings by 22% in the last 30 days to 35.24 billion coins.
Shiba Inu Price Technical Analysis
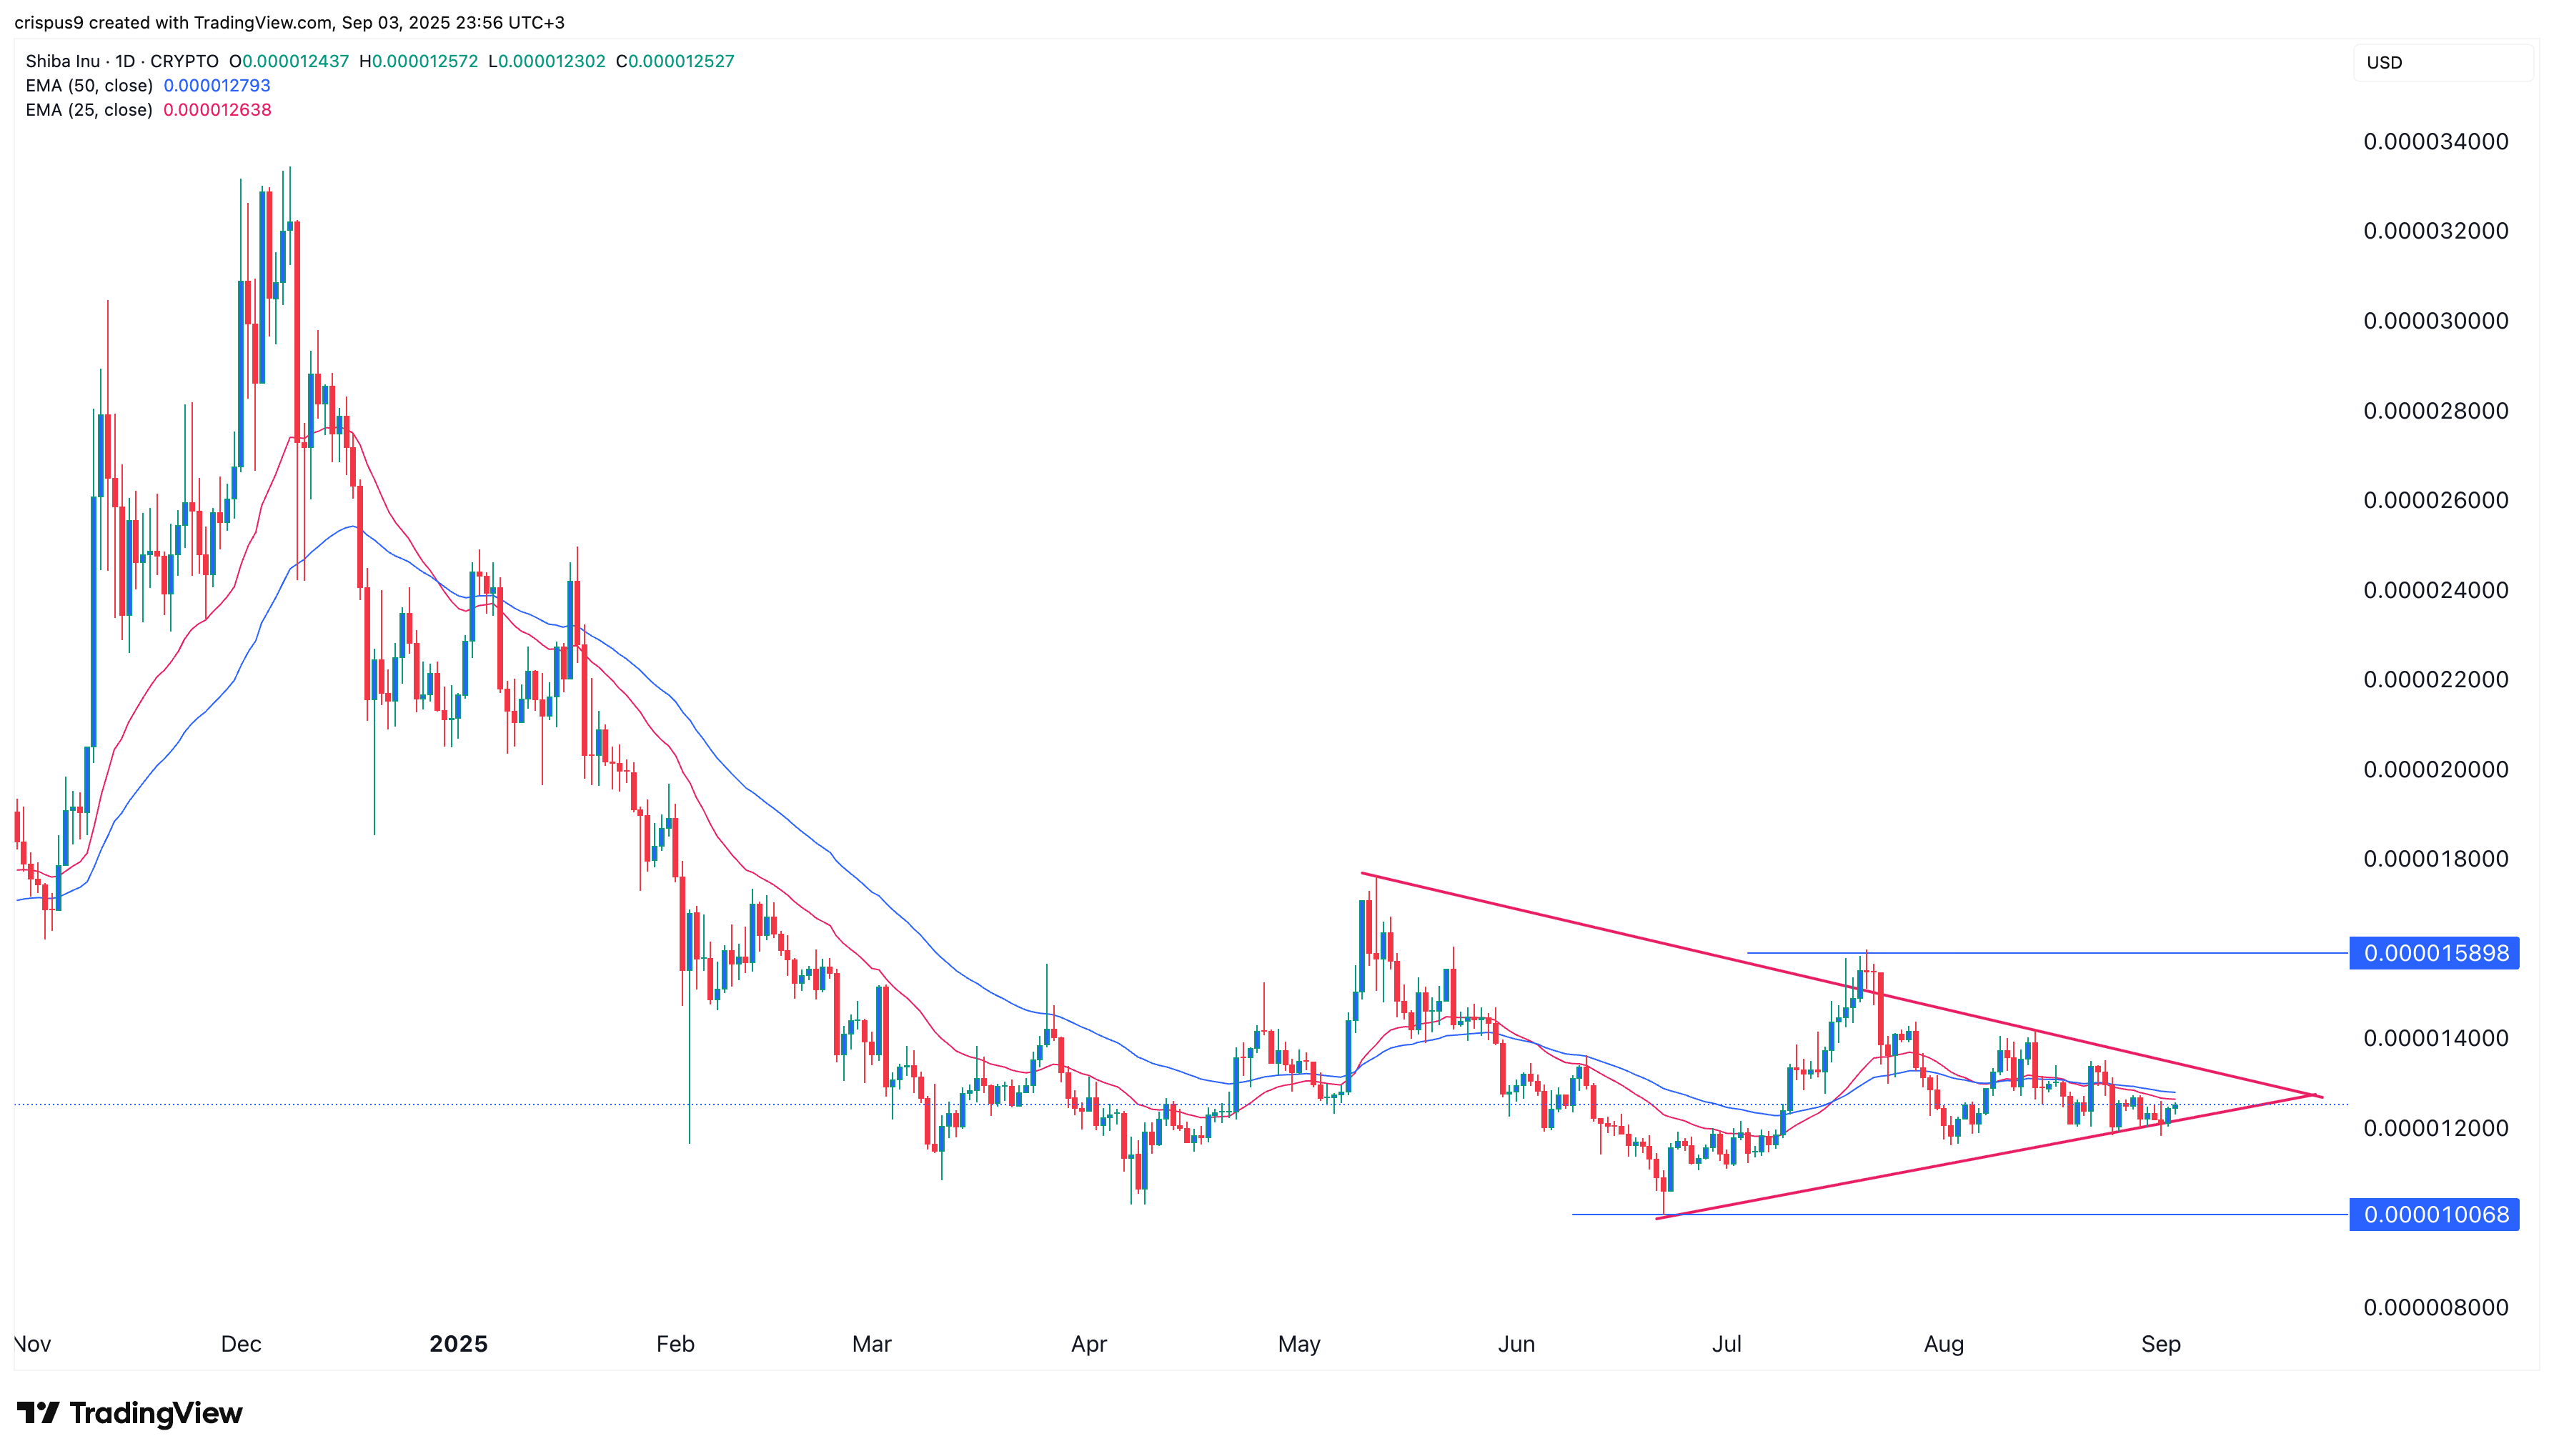
The daily timeframe chart shows that the Shiba Inu price was trading at $0.00001250 in the past few weeks. This price coincides with the 50-day and 25-day Exponential Moving Averages (EMA).
Shiba Inu’s Average True Range (ATR) has continued falling, a sign that the volatility has dried up.
Most importantly, the coin has formed a symmetrical triangle pattern, with the two lines nearing their confluence level. In most periods, a bullish or bearish breakout normally happens when the two lines are about to converge.
Therefore, the next key support and resistance levels to watch are at $0.00001 and $0.000016.
READ MORE: WLFI Price Prediction: Will World Liberty Coin Rebound or Crash?