

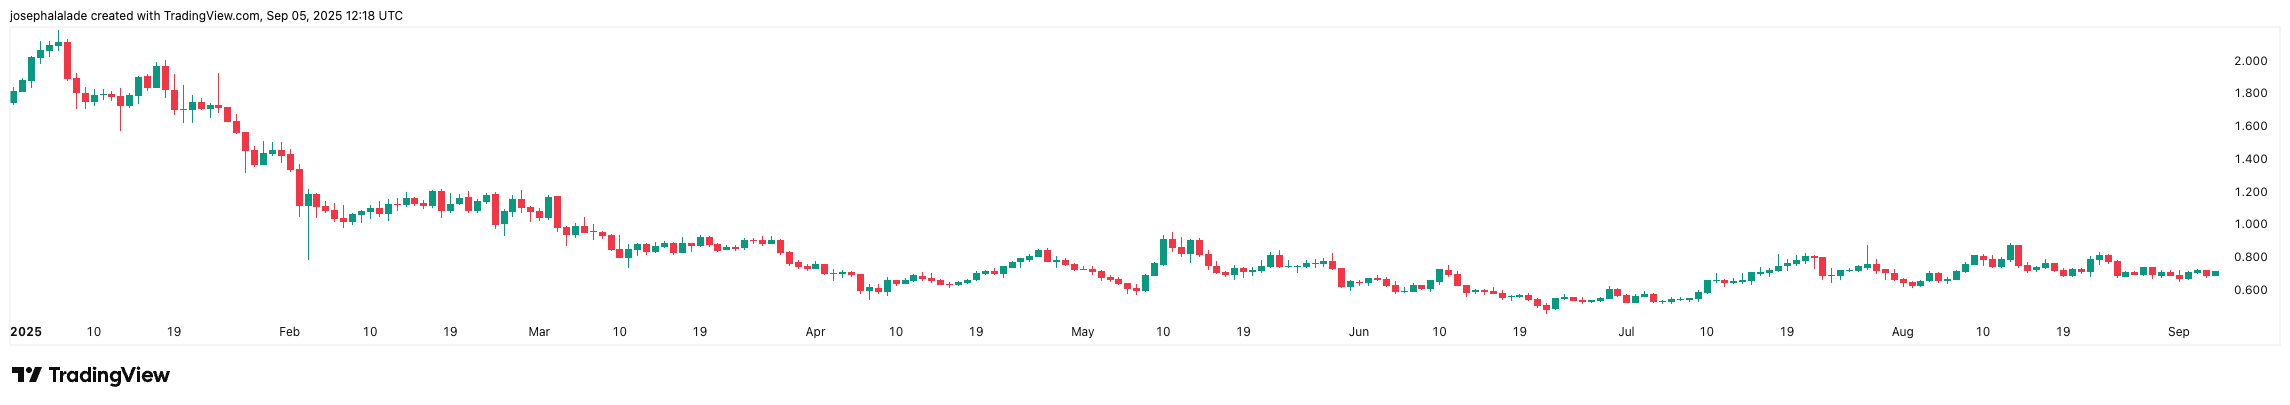
Optimism price (OP) is clinging to a fragile recovery this week, hovering around $0.71 after a slight 1.2% daily gain, but the bounce masks deeper structural weakness.
The token’s market cap sits at $1.26 billion, backed by 24-hour volumes of just $104 million, a sharp 27% slide that signals waning conviction among traders.
Despite a small green candle, OP price remains down nearly 47% year-on-year and 59% year-to-date, making it one of the weakest performers in the L2 basket.
Further, the contrast between ecosystem growth and token price is hard to ignore. Optimism’s active addresses hover at 62,000 daily, ranking it only 10th among Layer 2 networks, with peers like Base and opBNB commanding multiples higher.
Institutional Headlines Fail To Spark OP Price Momentum
On paper, the fundamentals look supportive. The Optimism Superchain narrative is alive, with chains like Base and Unichain building on the OP Stack, driving aggregate L2 volume on Uniswap past $50 billion in August, a new all-time high.
READ MORE: Can Bitcoin Price Revisit ATH as Gold Soars and Fed Cut Odds Jump Ahead of NFP Data?
Optimism Labs was quick to celebrate the milestone on social media, framing it as validation that the right infrastructure breaks records.
Yet, the market’s reaction has been underwhelming. Traders on X remain skeptical, focusing less on ecosystem bragging rights and more on OP’s underperformance versus rivals.
Even high-profile analysts like Michaël van de Poppe note Optimism price is still capped under its 21-week EMA, arguing it’s “a matter of time” before a breakout. But until that level clears, the path of least resistance remains sideways or down.
Meanwhile, on-chain metrics paint a cautious picture. DefiLlama data shows TVL on OP Mainnet has slipped to $598 million, down nearly 8% in 24 hours, with fees and revenues stagnating.
Optimism Price Outlook: Technicals Tilt Bearish
Short-term traders may find some encouragement in intraday charts: OP bounced off the $0.70 floor and trades above the 7-day and 50-day moving averages ($0.698 and $0.704).
However, the broader setup is far from bullish. The 200-day MA sits higher at $0.728, acting as stiff resistance that has rejected multiple rallies since July.
Technical dashboards back up this caution. On TradingView, oscillators remain neutral, but moving averages skew heavily toward “sell,” with nine sell signals versus five buys. Relative Strength Index (RSI) at 49.6 shows neither oversold nor momentum strength, suggesting traders lack urgency on either side. Santiment’s Z-Score also tilts negative, reinforcing the idea that OP is trading below fair activity benchmarks.
Therefore, unless Optimism price can decisively clear $0.73–$0.75 resistance, the token risks rolling over toward the $0.65–$0.66 zone, where it last found demand.