


Pepe price has plunged in the past few days, moving from a high of $0.00001260 on September 13 to $0.0000109, a 13% drop. This article explores what to expect as whale dumping coincides with the plunging exchange reserves.
Whales are Dumping Pepe Coins
On-chain data shows that whales have continued selling the Pepe Coin this month, a sign that it could be on track for more downside in the near term.
Whale investors hold 7 trillion Pepe tokens today, a 16% drop from the same period last month. These investors held about 8.02 trillion tokens at the peak in August.
Other large participants have also dumped the coin this month. Public figures have reduced their positions to 100 billion, down from 291 billion at the peak in August.
Smart money investors’ holdings have also dipped by 2% in the past few weeks to about 320 billion tokens. All these numbers mean that some of the most influential investors in the crypto industry are concerned about Pepe coin.
READ MORE: Pi Network Price Prediction: 1 Key Reason Pi Coin Value May Jump Soon
The other potential risk that Pepe faces is that the futures open interest has continued rising as its price drops. That could be a sign that there is increased selling pressure.
On the positive side, the amount of Pepe tokens in exchanges has continued falling this month. The volume has plunged to 252.22 trillion, down from over 258 trillion earlier this month. Falling exchange balances are a sign that investors are not selling their tokens, which is a bullish sign.
Pepe Price Technical Analysis
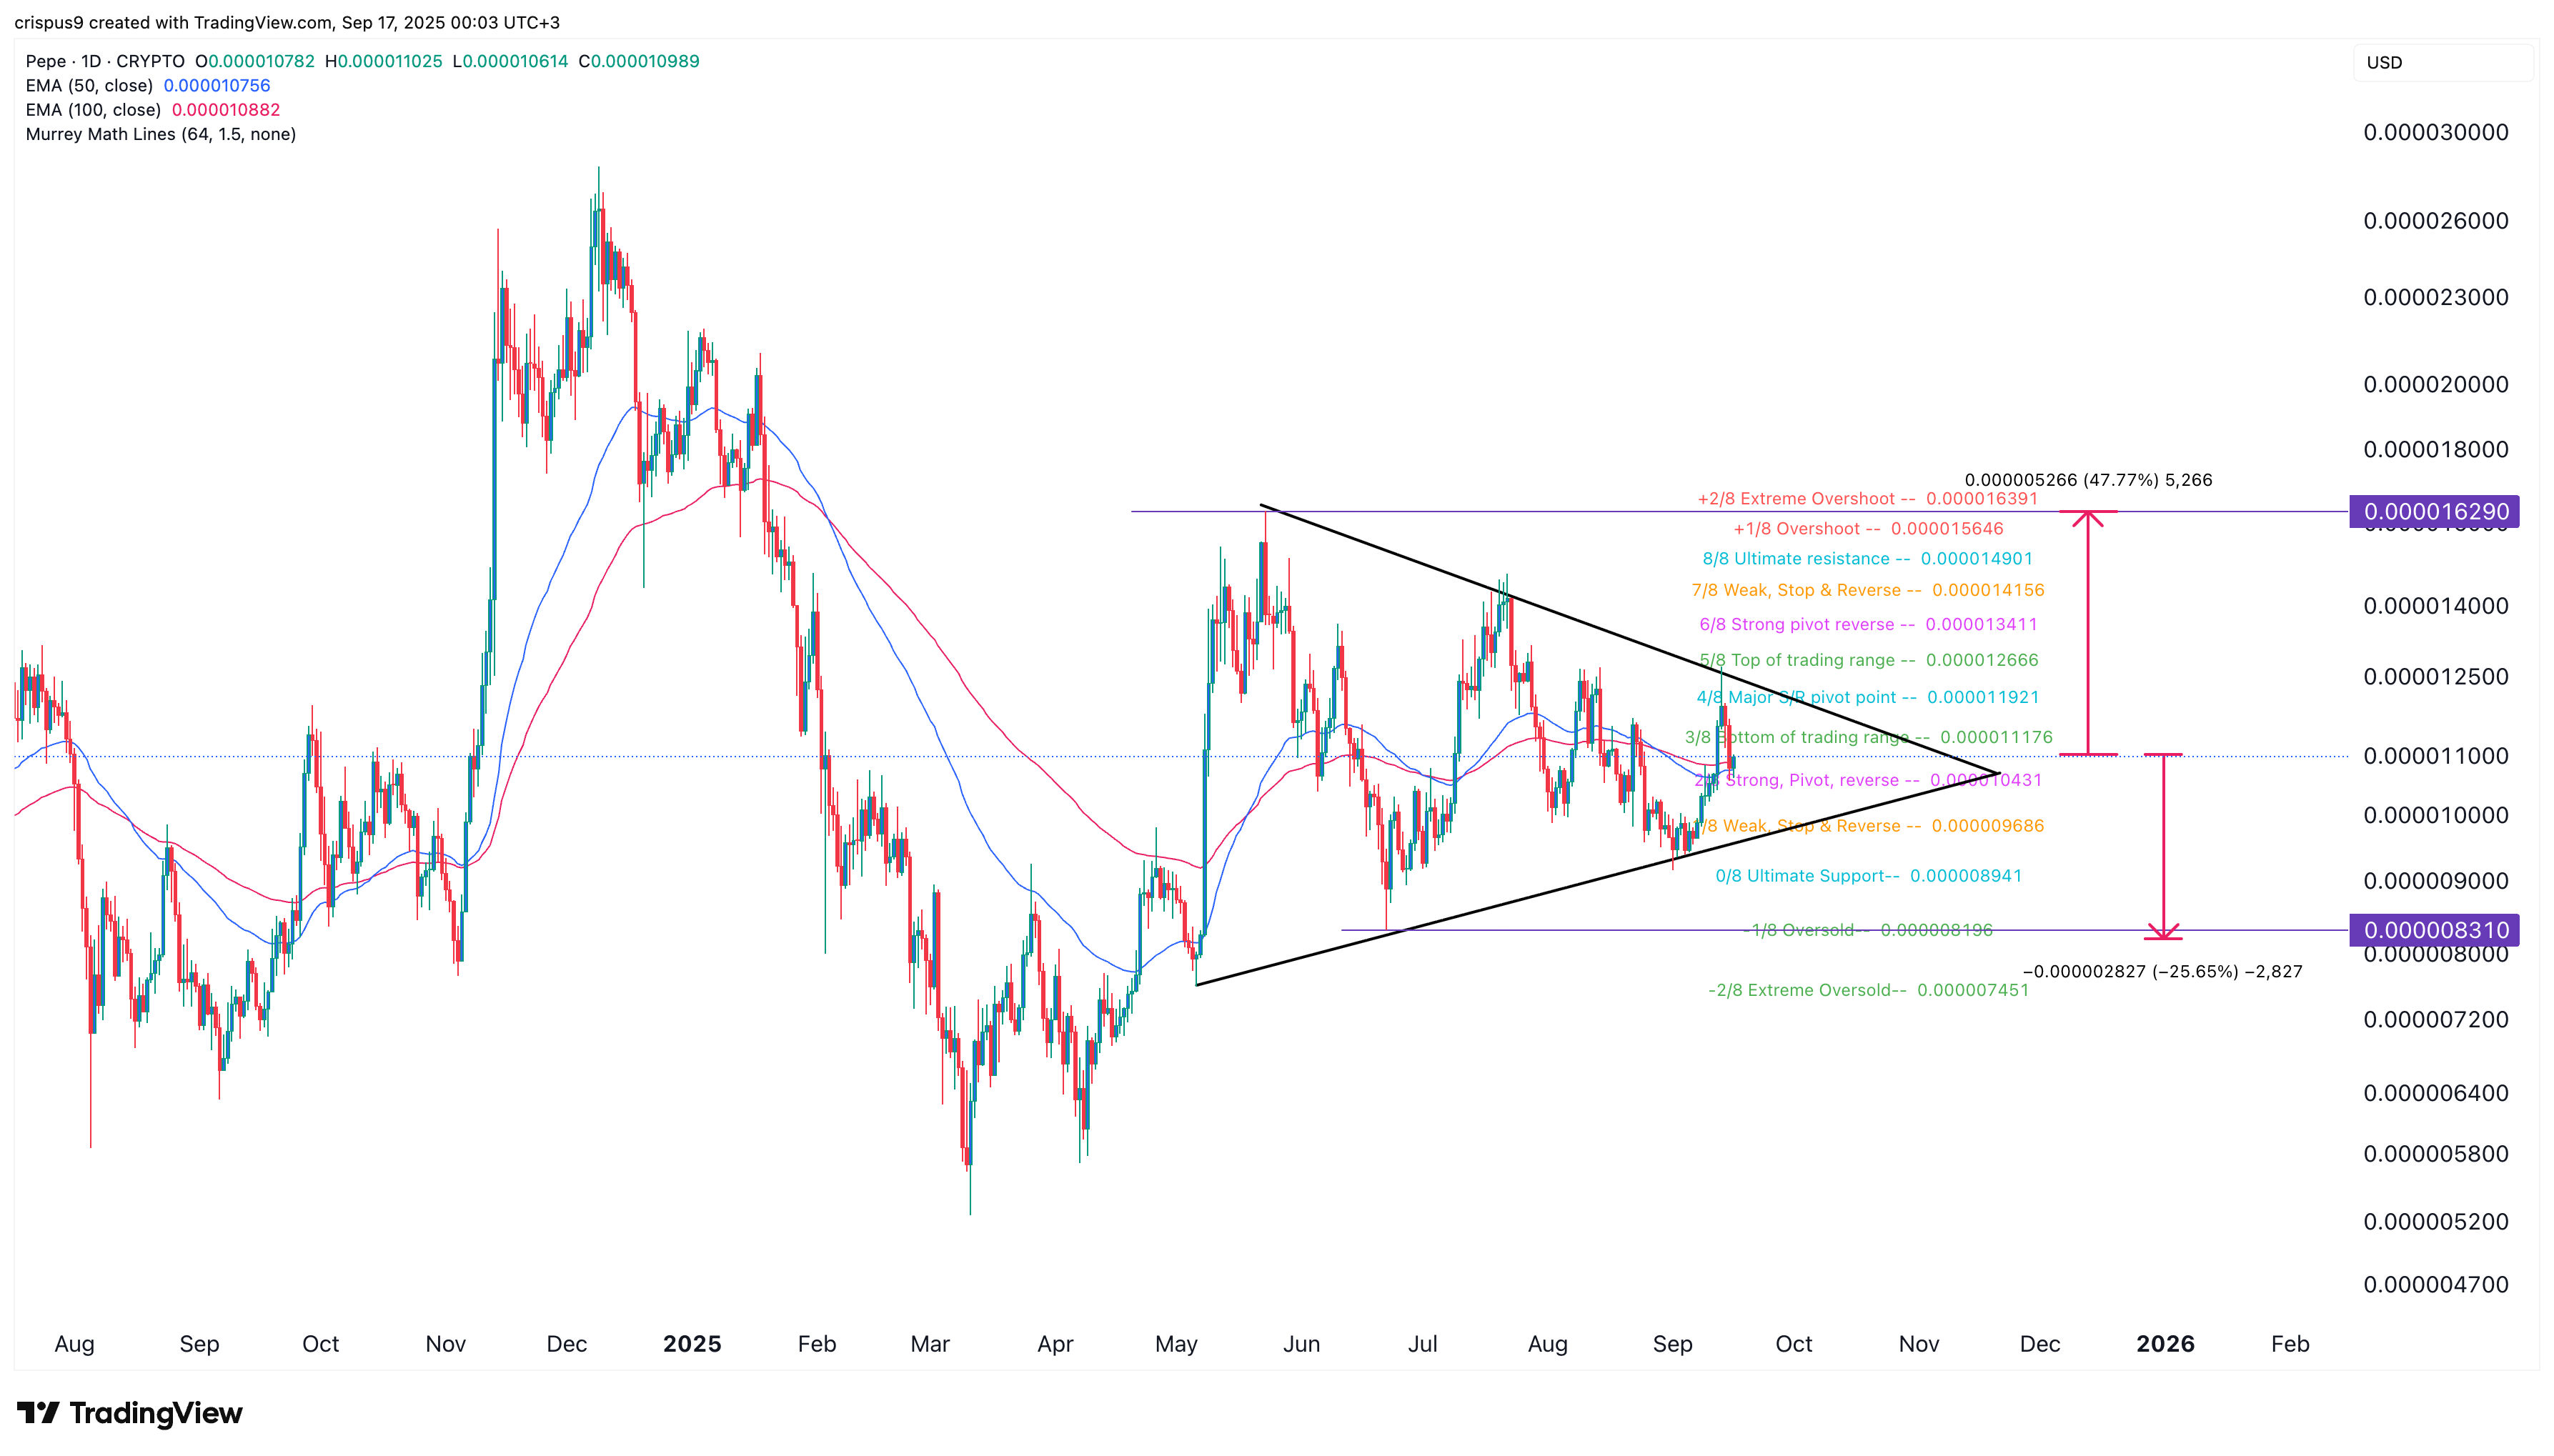
The daily timeframe chart shows that the Pepe Coin price attempts to rebound found substantial resistance at $0.00001268 on September 14 and then pulled back to the current $0.00011.
The coin has settled at the 50-day and 100-day Exponential Moving Averages (EMA). Most notably, it has formed a symmetrical triangle pattern whose two lines are about to converge.
Pepe Coin’s price is also at a strong pivot reverse of the Murrey Math Lines. Therefore, the coin will likely remain in this range in the near term and then break out in either direction.
A bullish breakout will see it retest the extreme overshoot level at $0.00001630, which is about 47% above the current level. On the other hand, a drop below the support at $0.000008310, down by 25% from the current level.
READ MORE: XRP Price Prediction: Here’s Why Ripple is About to Soar