


A crypto crash has occurred over the past few days, erasing billions of dollars in value, with Bitcoin and top altcoins like Avantis (AVNT), Ethereum (ETH), and Ripple (XRP) plummeting. This article explores why the crypto market crashed and whether these coins will rebound soon.
Why the Crypto Crash is Happening
There are at least three primary reasons why the cryptocurrency market is experiencing a crash. First, the plunge happened because of forced liquidations of leveraged cryptocurrencies worth over $1.8 billion in the last 24 hours. The liquidations increased by over 800% from the previous day.
Second, the cryptocurrency market plunged as profit-taking among investors accelerated following the Federal Reserve’s interest rate decision on Wednesday of last week. Since most coins were up before the decision, the ongoing panic selling is part of a situation known as selling the news.
Third, the ongoing crypto crash is also happening after last week’s options expiry, and the fact that the most recent rebounds have faced substantial resistance.
Avantis Price Prediction
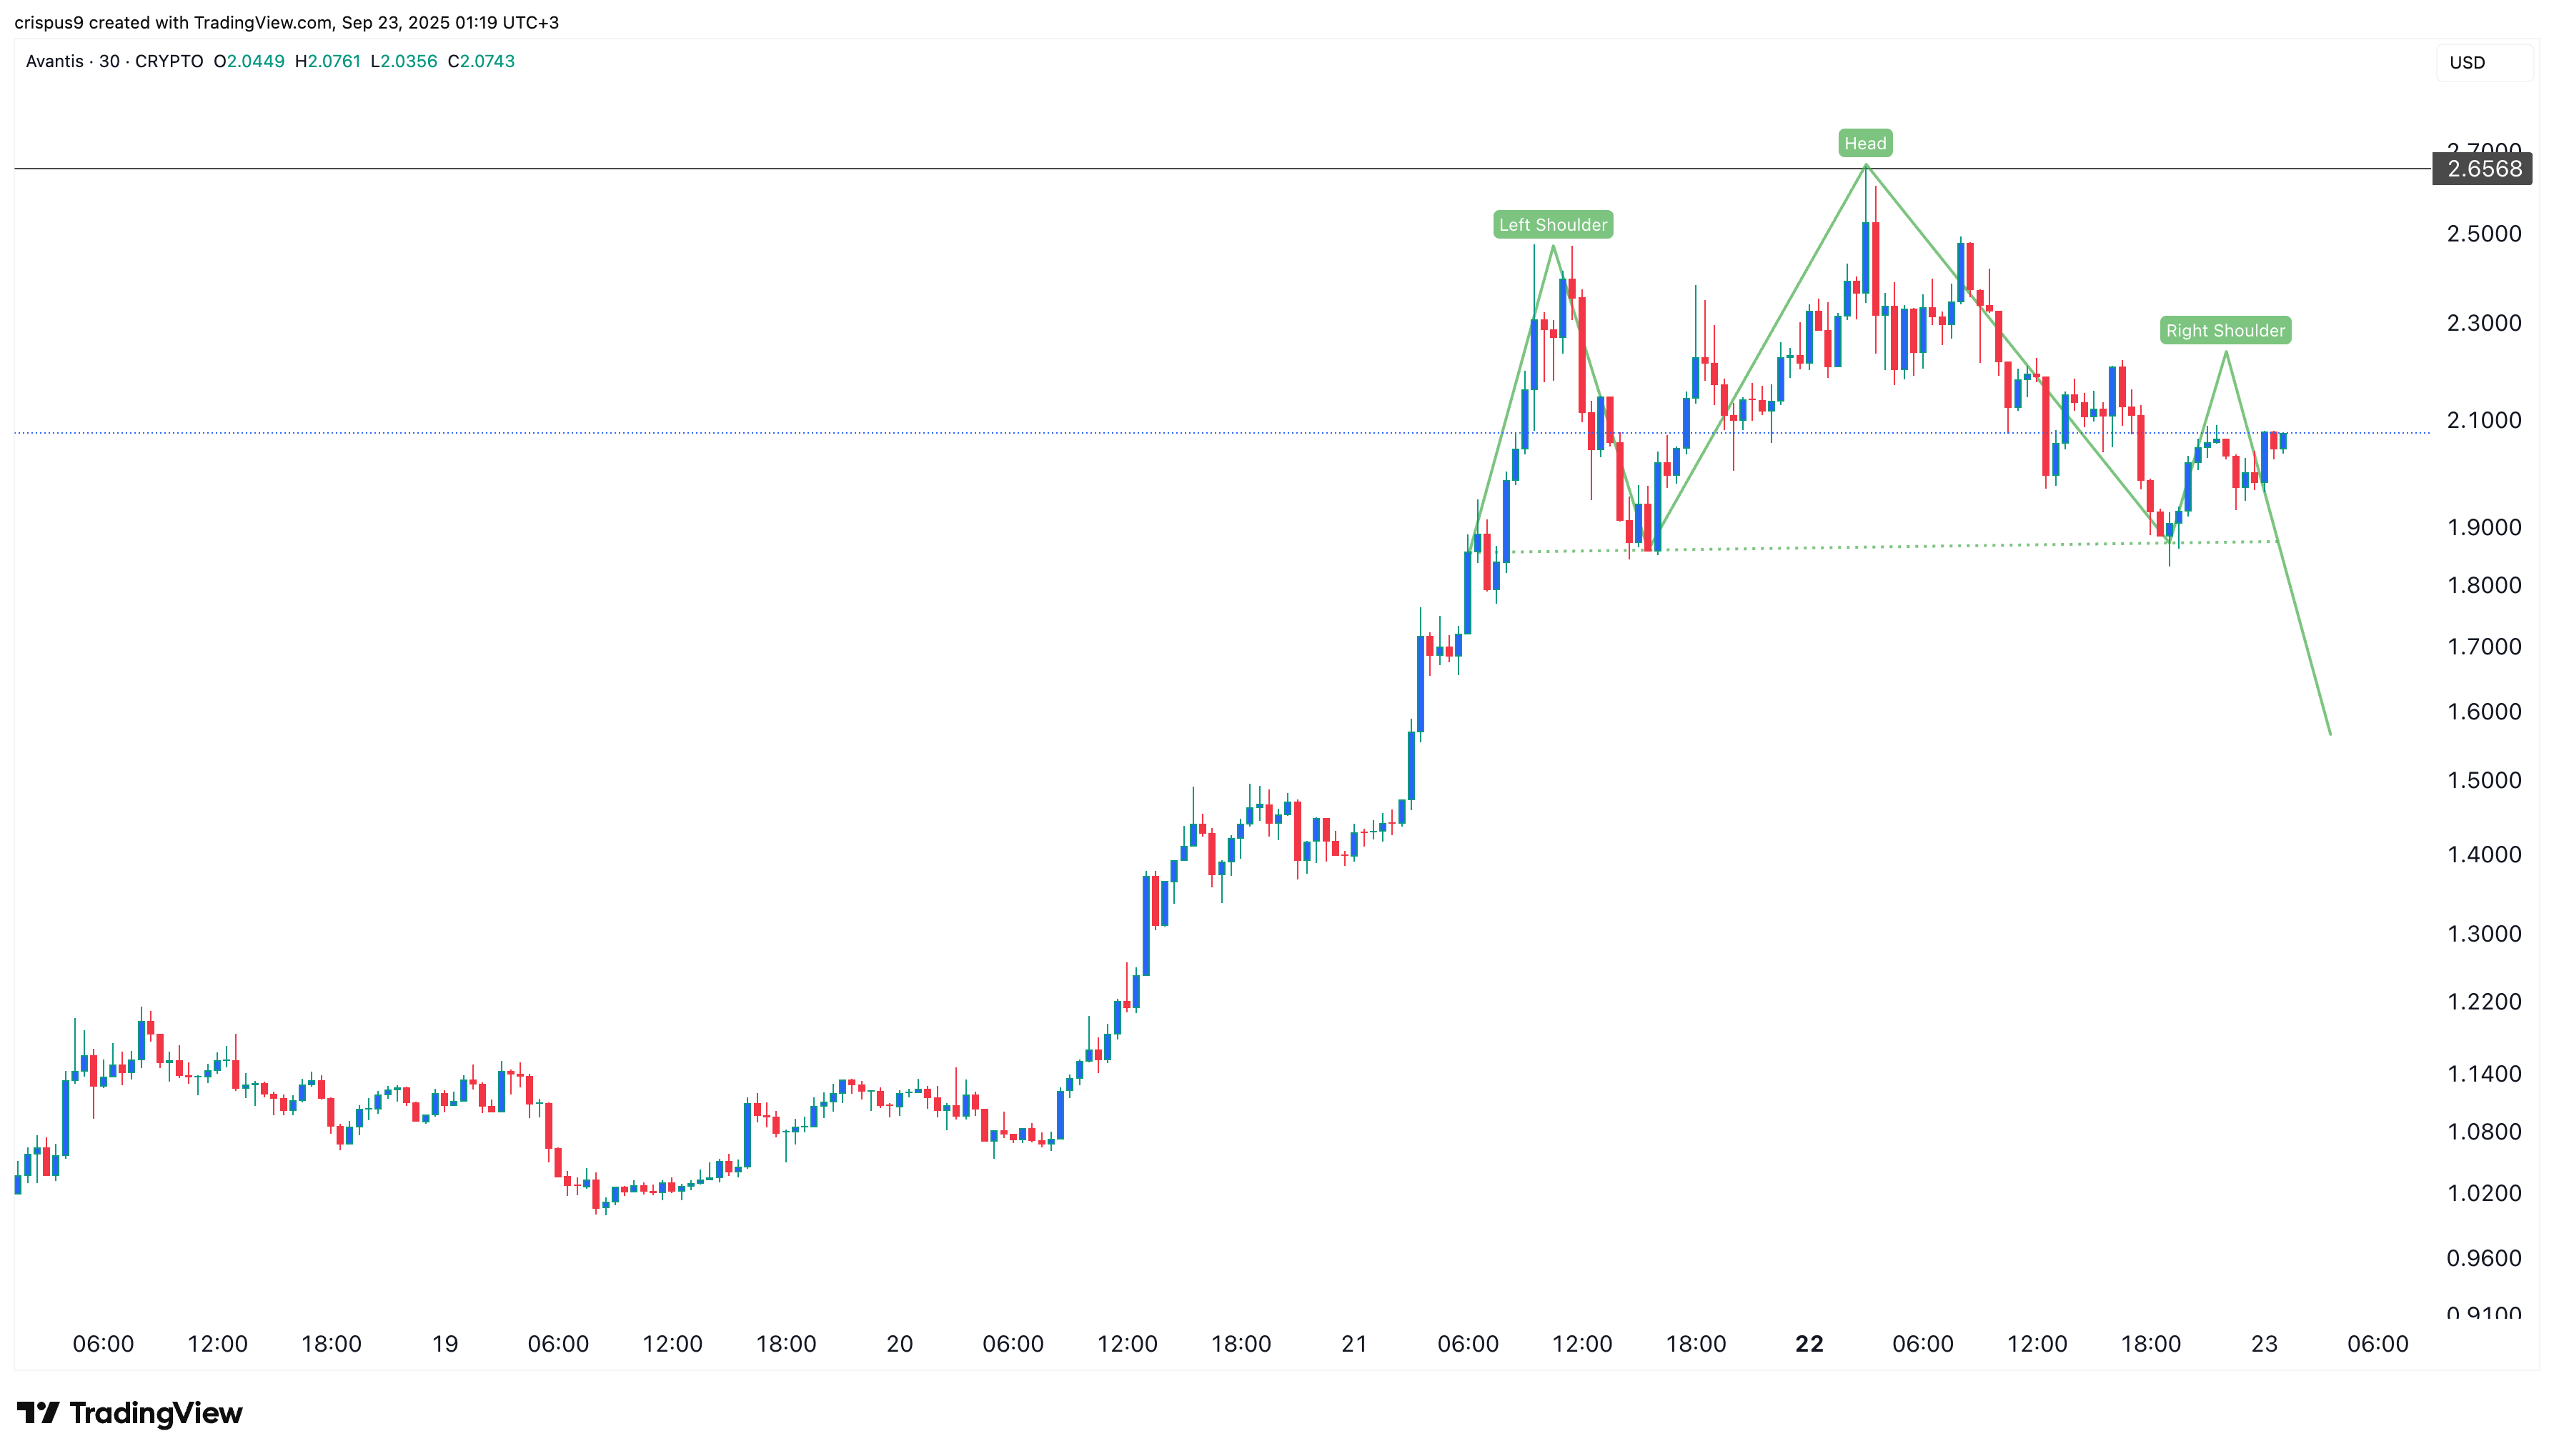
The Avantis crypto price has been one of the best-performing coins over the past few weeks, jumping from $0.1268 to a record high of $2.60.
This jump was largely due to the rising demand for perpetual exchange tokens and those on the Base Blockchain. Also, data shows that the volume in its exchange has soared and even crossed what it handled last month.
The 30-minute chart shows that the AVNT price has lost momentum over the past two days and has formed a highly bearish head-and-shoulders pattern. That is a sign that it will pull back during this crypto market sell-off and then resume the uptrend later this week.
Ethereum Price Prediction
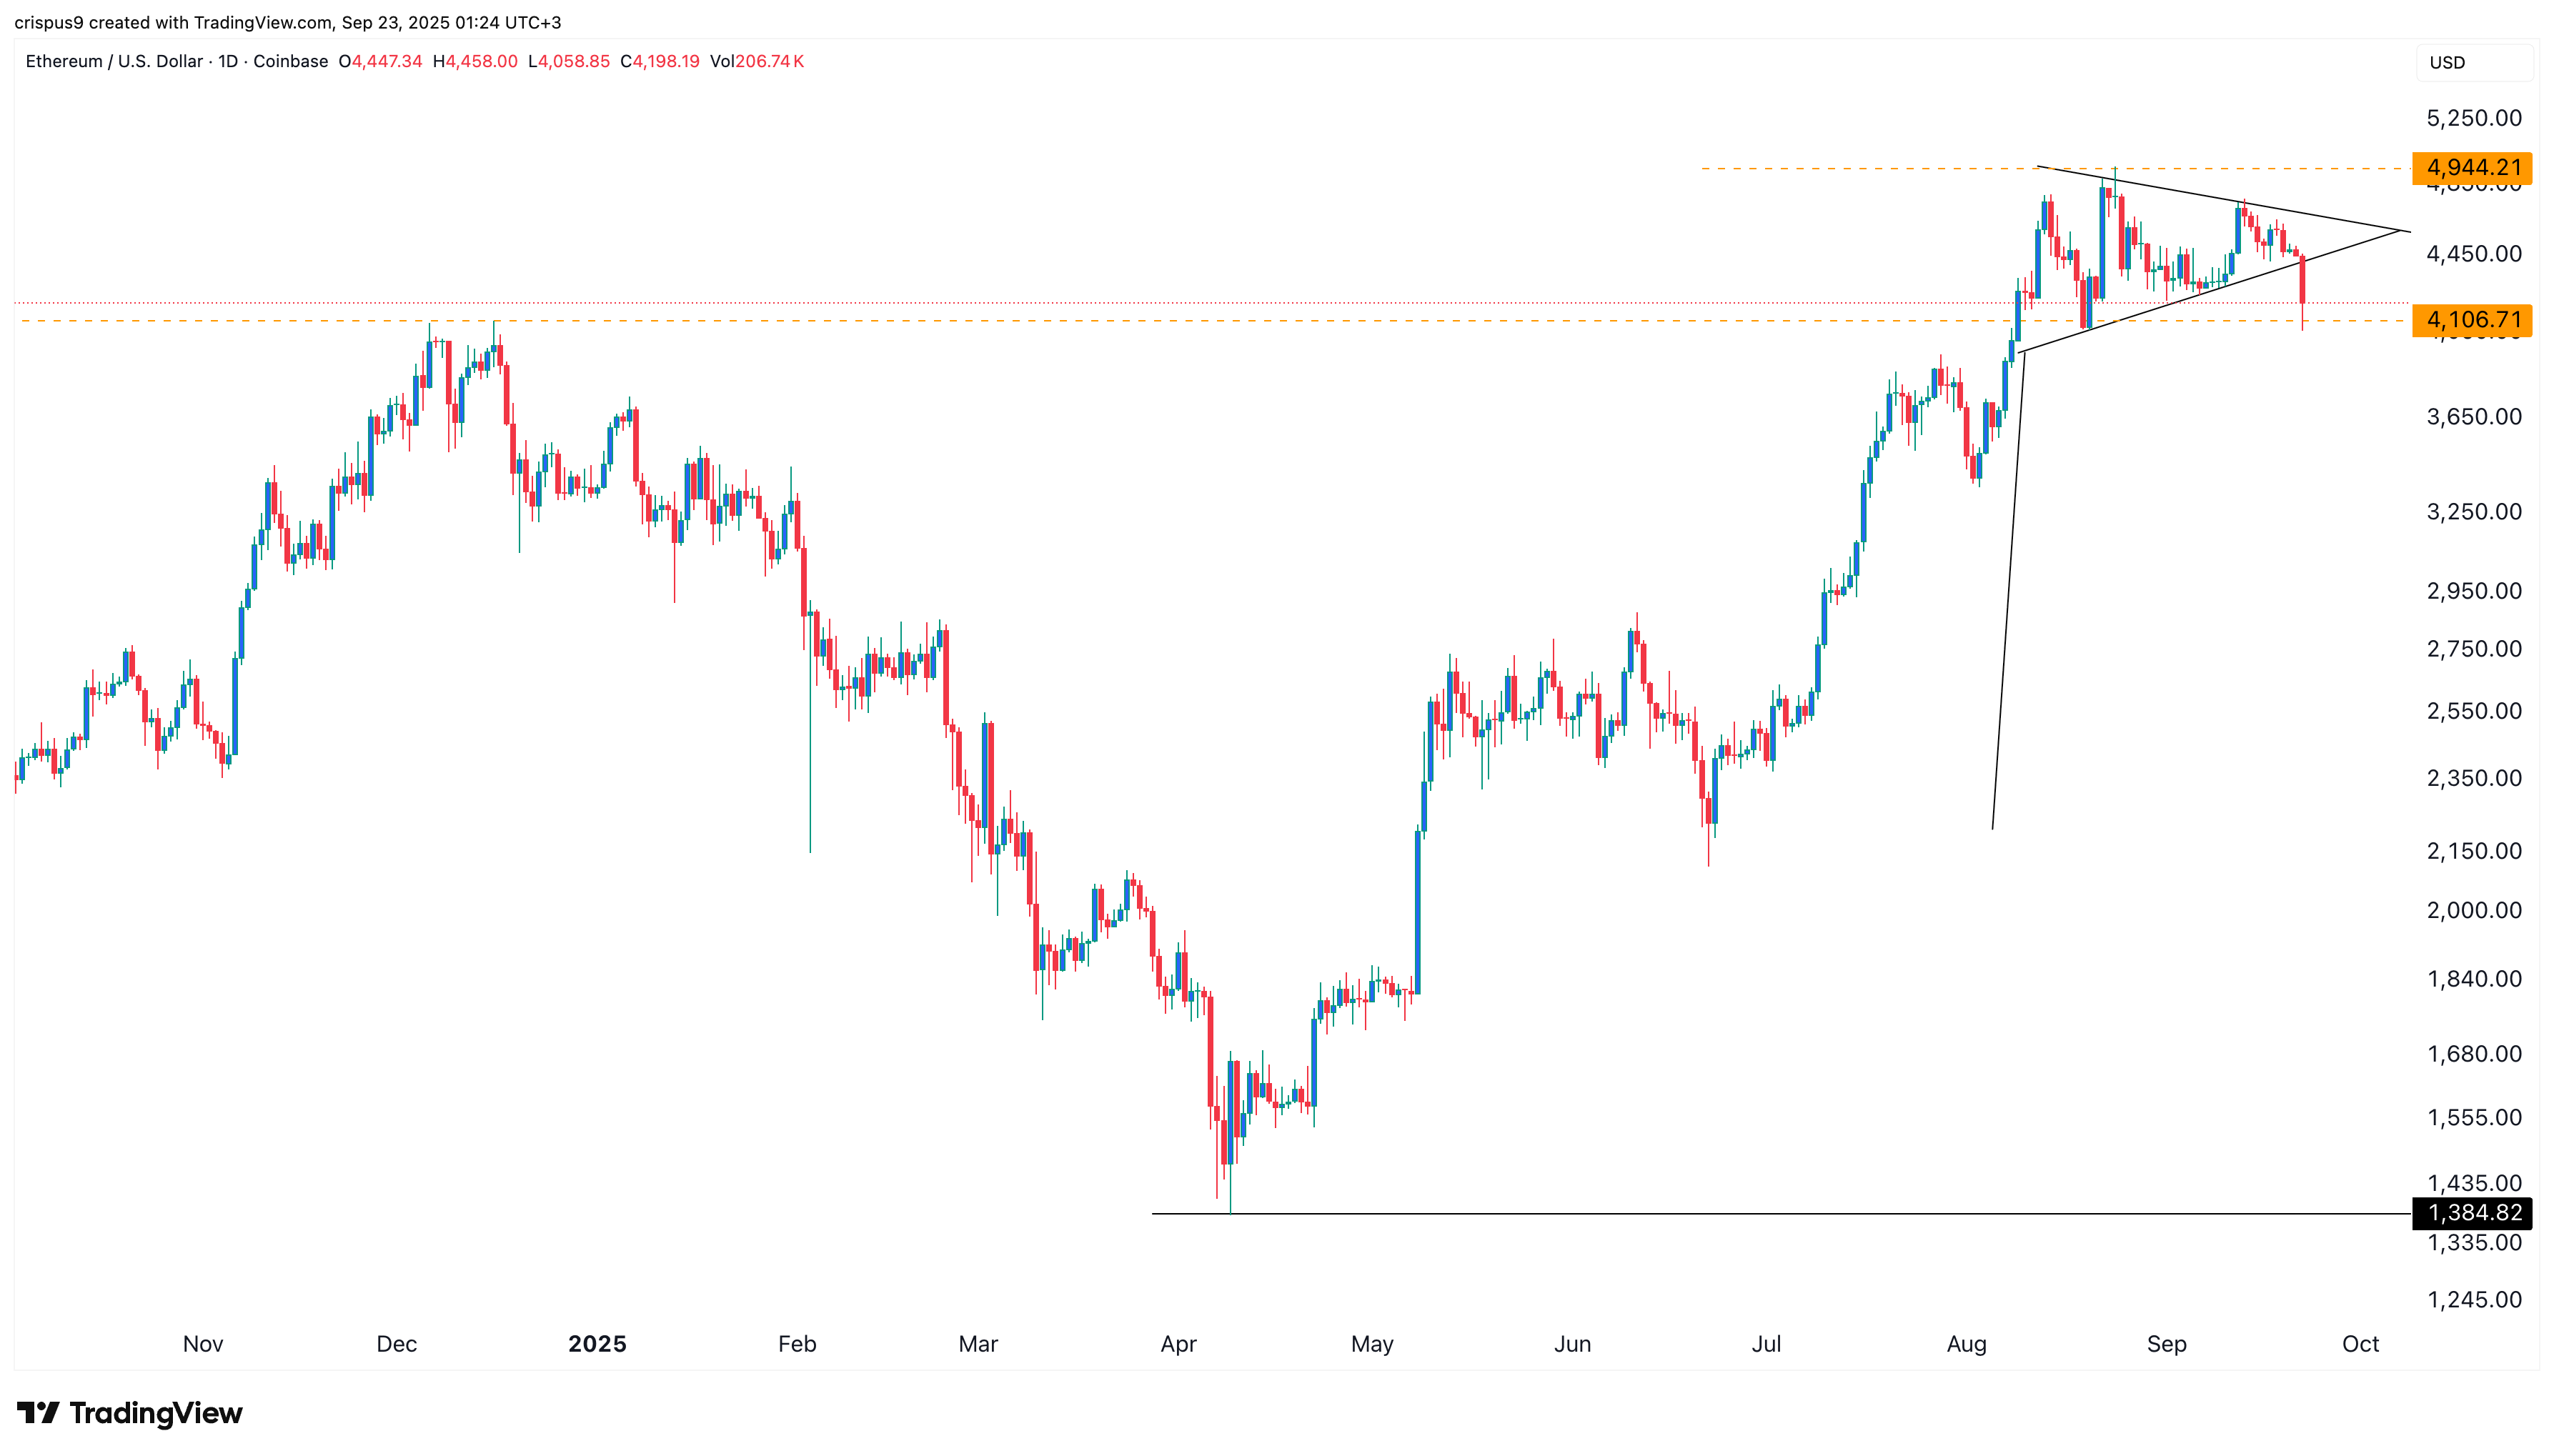
The daily timeframe chart shows that the Ethereum price has jumped from the year-to-date low of $1,384 in April to a high of $4,945.
Recently, however, it has consolidated and formed a symmetrical triangle pattern. This pattern was part of the bullish pennant chart pattern, which often leads to more gains.
The bullish pennant was invalidated on Monday as the coin dropped below its lower boundary. On the positive side, this plunge was likely a shakeout, which normally precedes a breakout. Indeed, the coin has formed a hammer candlestick pattern, which is a common reversal sign.
READ MORE: Keeta Launches Mainnet to Challenge Solana, Ethereum, and Tron
Therefore, the ETH price is likely to lead to a strong bullish breakout, potentially hitting the year-to-date high of $4,945. A break above that level will signal further gains, potentially reaching $5,000 and beyond.
XRP Price Prediction
The daily timeframe points to a strong bullish breakout in the coming weeks. It has formed a falling wedge pattern, which is made up of two descending and converging trendlines.
XRP price has also formed a bullish flag pattern, which is comprised of a vertical line and a descending channel, resembling a hoisted flag.
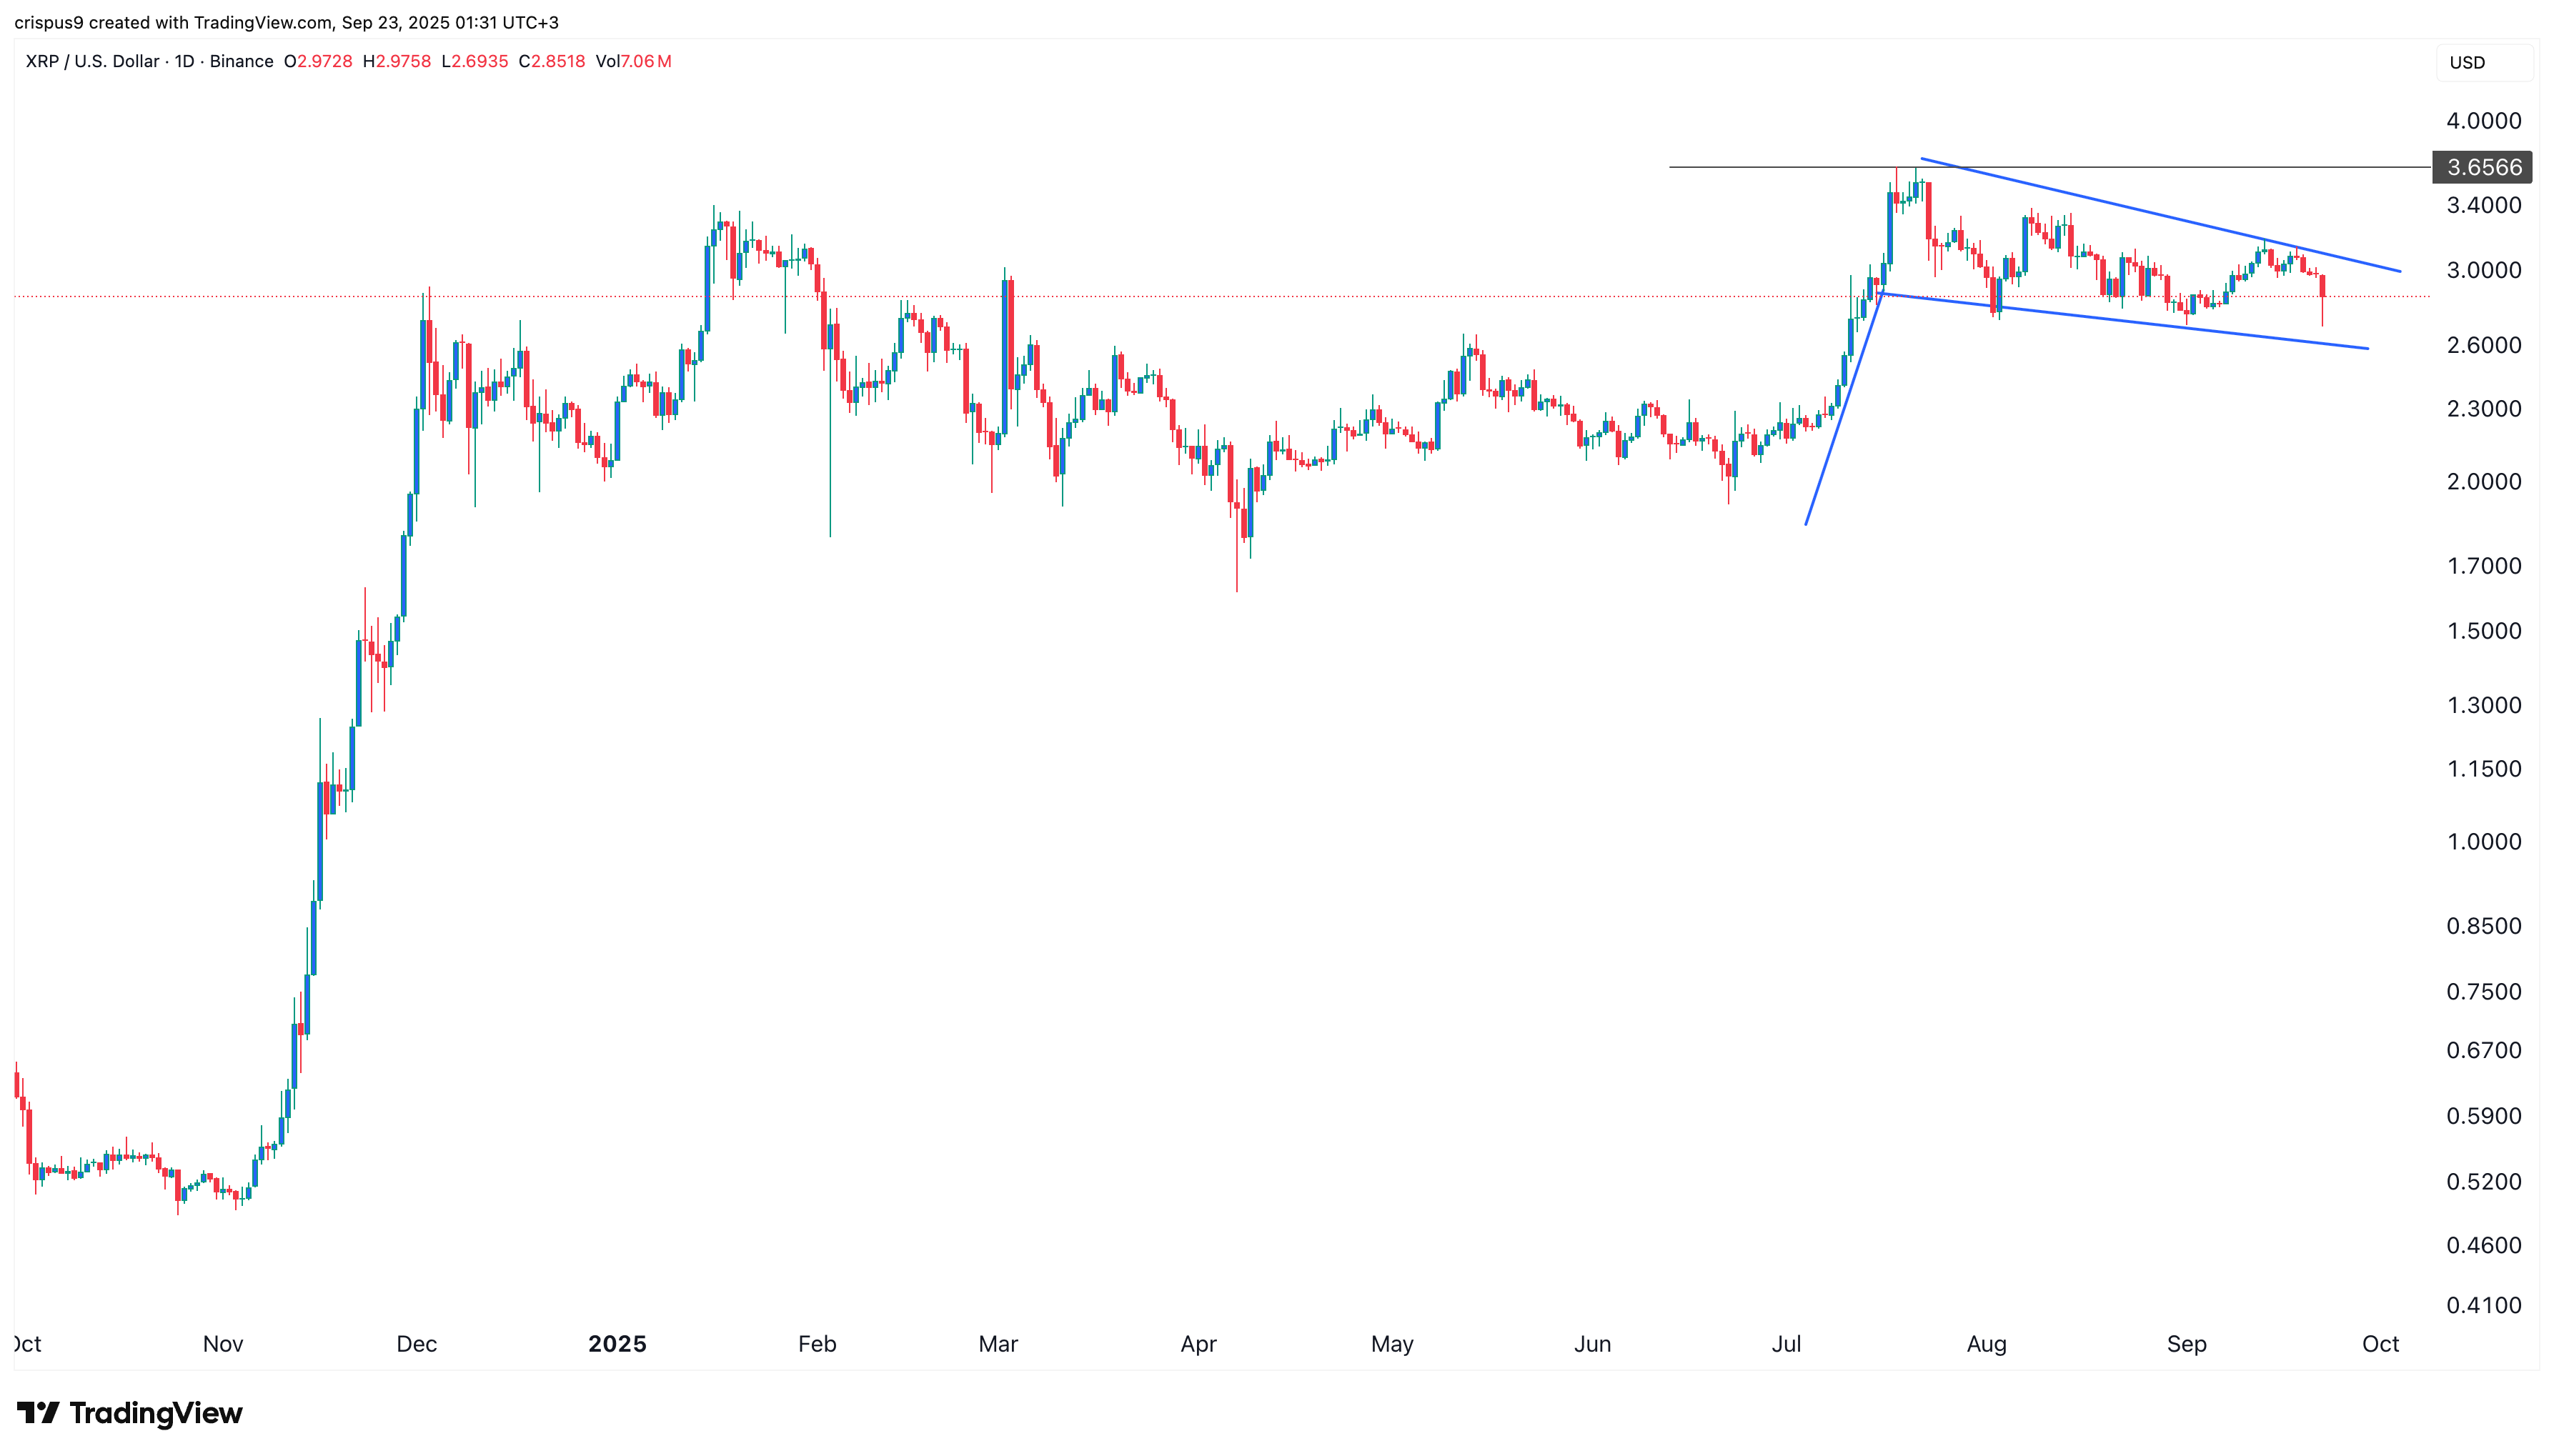
Therefore, the coin is likely to experience a strong bullish breakout, potentially reaching the year-to-date high of $3.6565, which is approximately 30% above the current level. The bullish view will become invalid if it crashes below the lower side of the wedge pattern.
READ MORE: HBAR Price Prediction: Hedera Elliot Wave Points to a Surge