


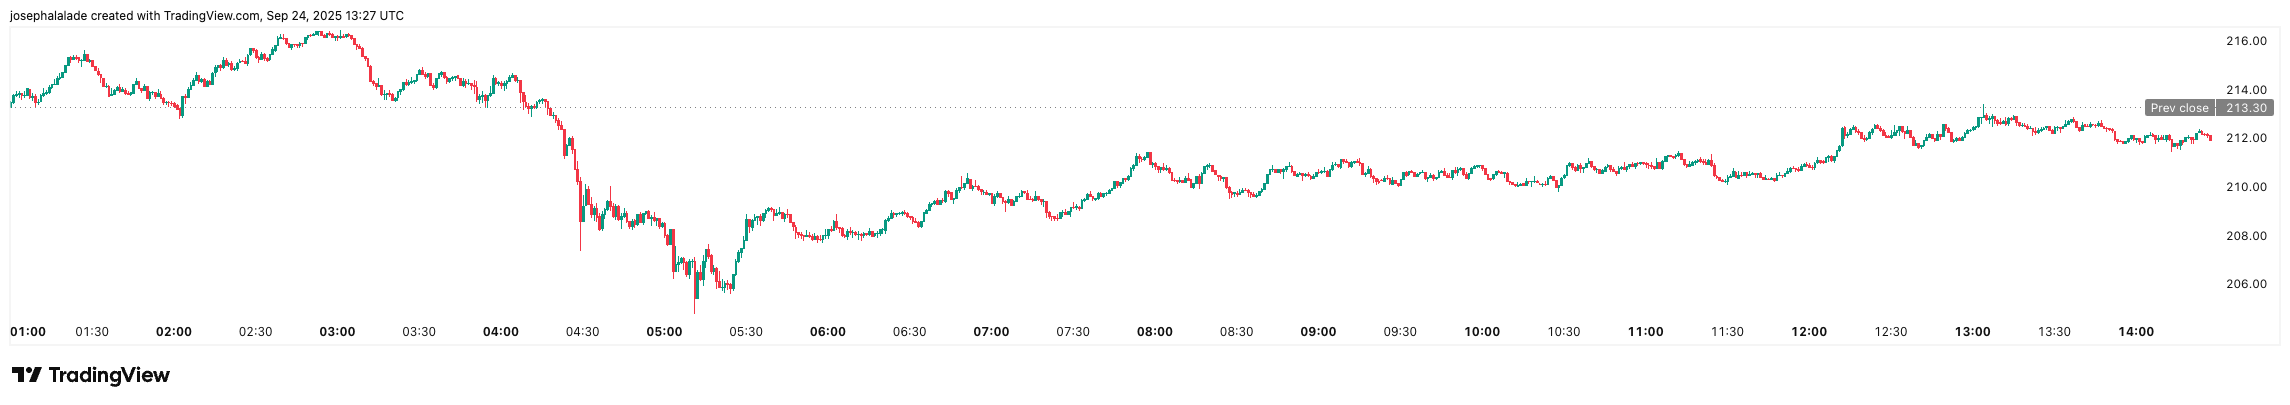
The Solana price (SOL) is back under pressure, having dropped 4% in the past day to around $210. Trading volume sank 12% to $8.55 billion, while market cap slipped to $114.3 billion, per CoinMarketCap.
This decline has led to weekly losses of over 11%. However, the SOL coin is still up 11% this year and 45% over the past year. Currently, SOL trades at 28% below its all-time high of $294, set in January 2025, but it is still 41,600% higher than its low of $0.50 in 2020.
This correction comes as broader crypto sentiment weakens ahead of macro catalysts. Investors are bracing for the release of Core PCE inflation data on September 26, which could weigh on risk assets.
Why Solana Price Is Falling: Technical Breakdown Adds Pressure
From a technical perspective, the Solana price is flashing warning signs. The token broke below its 30-day simple moving average (SMA) at $218.73 and the 38.2% Fibonacci retracement level near $227.55, both widely watched support zones.
Momentum indicators confirm the bearish tilt. The MACD histogram sits at -3.12, reflecting negative momentum, while the Relative Strength Index (RSI) at 44.9 suggests SOL still has room to fall before entering oversold territory.
Traders are eyeing the next major support near the 50% Fibonacci retracement at $219.62, which also aligns with September’s pivot point around $215.96. A decisive close below $210 could trigger algorithmic selling and open the door to a deeper correction toward the $200 psychological level.
Market sentiment reflects this caution. TradingView’s SOL/USDT technical dashboard shows 10 sell signals versus just seven buy signals across moving averages and oscillators. Short-term momentum indicators, including stochastic RSI and commodity channel index (CCI), are also tilted bearish.
$210 Remains Critical Support for SOL
Despite the near-term weakness, analysts remain optimistic that SOL could surge in the near future. Market analyst Ali Charts highlighted a “double buy signal” from the TD Sequential indicator, arguing that defending $210 could fuel a move back toward $250.
Another strategist, MarketMaestro, pointed out that SOL’s current pullback may form an inverse head-and-shoulders (H+S) pattern on the weekly chart. This is a bullish reversal chart pattern commonly observed at the end of a downtrend. It suggests a potential shift from a bearish to a bullish trend.
If confirmed, this setup could trigger a breakout above resistance and ignite a rally toward $260.
Still, short-term trading remains volatile. The Solana price’s intraday swings between $206 and $221 mirror the battle between dip buyers and profit takers. For now, the $210 zone stands as a key battleground.
READ MORE: ReserveOne Files SEC Registration for $1B Nasdaq SPAC Deal