The XLM price has rebounded over the past few weeks, rising from its September low of $0.3437 to a high of $0.4145 as the crypto market recovered. It remains about 25% below the year-to-date high of $0.5185. This article explores some top reasons why the Stellar Lumens price may be on the cusp of a strong bullish breakout soon.
Stellar Network Growth and Potential ETF Filing
One of the primary catalysts for the XLM price is the ongoing growth of the network and ecosystem, which is expected to accelerate in the coming weeks.
Data compiled by Nansen shows that Stellar’s active addresses jumped by 14% in the last 30 days to 88.4 million. This growth makes it one of the fastest-growing players in the crypto industry.
Stellar’s active addresses also continued growing in the last 30 days. They jumped by 3% to 331,857.
Meanwhile, Stellar’s network has also continued to grow in the real-world asset tokenization industry, where its assets have increased by 20% over the last 30 days to $640 million. This growth makes it the eighth-largest player in the RWA industry, after Ethereum, ZkSync, Polygon, Arbitrum, Avalanche, Aptos, and Solana.
READ MORE: Zcash Price Prediction: Why ZEC Jumped and Why it May Crash Soon
The biggest players in the Stellar Network’s RWA platform are Franklin Templeton, Circle, WisdomTree, Etherfuse, and GMO Trust.
Stellar has become a major player in the stablecoin industry, with its assets increasing by 11% over the last 30 days to $255 million. The stablecoin holders in Stellar jumped to 560,000, a trend that may continue after the recent Protocol 23 upgrade. Stellar’s total value locked in the network jumped by 12% to $158 million.
The Stella price is likely to benefit from the upcoming approval of crypto altcoin ETFs, which is expected to occur this month if the government shutdown ends. While no company has yet filed for an XLM ETF, there are signs that this may happen in the coming weeks.
XLM Price Technical Analysis
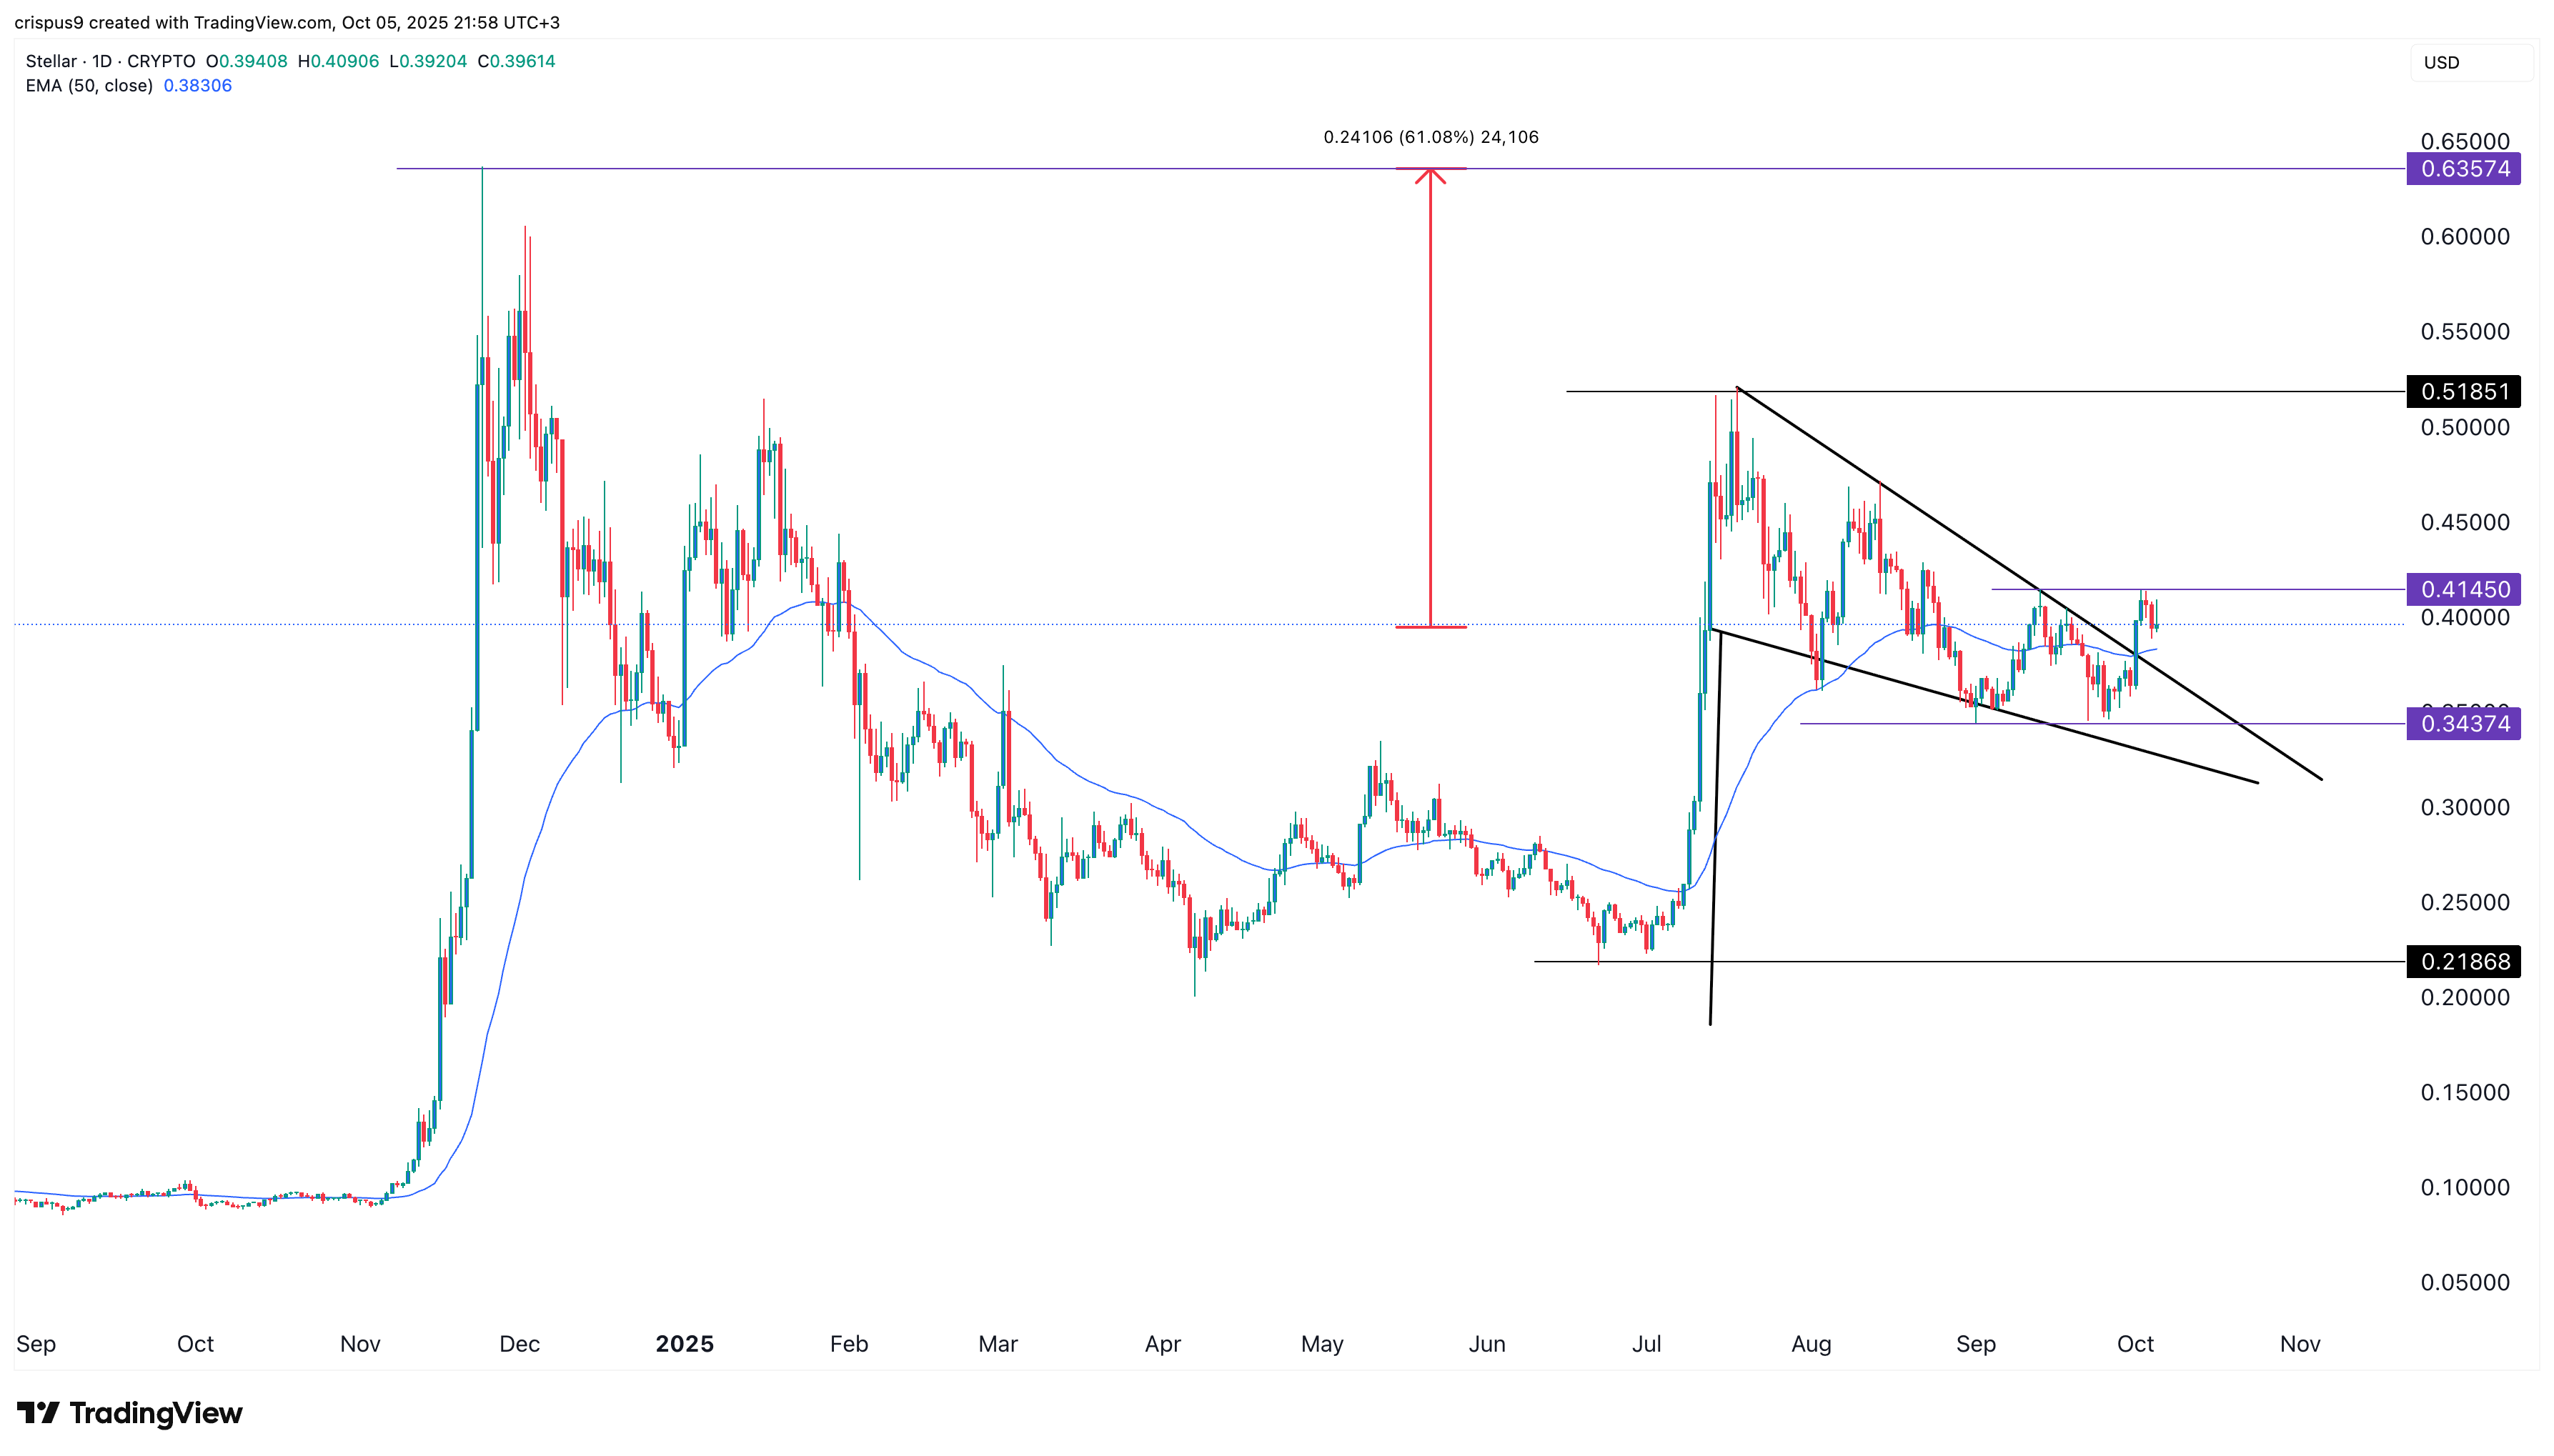
The daily timeframe chart shows that the XLM price bottomed at $0.3437 in September, where it formed a double-bottom pattern. This is one of the most common bullish reversal chart patterns in technical analysis.
XLM price has formed a highly bullish falling wedge chart pattern on the daily chart. This pattern is made up of two descending and converging trendlines, which often leads to a strong breakout.
Stellar price has moved above the 50-day Exponential Moving Average (EMA). It has formed a small bullish flag pattern. Therefore, the most likely scenario is one where the coin stages a strong bullish breakout, indicating further gains in the coming weeks.
If this happens, the next key level to watch will be at $0.5185, which is 31% higher than the current level. A move above that level will suggest further gains, potentially reaching last year’s high of $0.6357, which is 60% above the current level.
READ MORE: XRP Price Crashes Today—Is This the Last Dip Before a Major Rally?