


XRP price remains in a consolidation phase this week and is hovering near its highest point since September 19. Ripple was trading at the important resistance at $3, up by 10% from its lowest level in September.
XRP Ledger Network is Growing
One of the main bullish catalysts for the XRP price is that the network is seeing strong growth in key industries like decentralized finance (DeFi) and real-world asset (RWA) tokenization.
The total value locked in the DeFi industry has jumped to over $107 million, up from the January lows of $55 million. This makes it one of the fastest-growing layer-1 networks in the crypto industry.
The largest player in the XRP Ledger is OpenEden, which has over $172 million in assets. It is followed by other top players in the DeFi industry, such as Doppler Finance, XRPL DEX, and Ondo Finance.
Additionally, the XRP Ledger is becoming a major player in the stablecoin industry, where its total supply has jumped to $180 million, up from the year-to-date low of $72 million. Most of this growth has been driven by Ripple USD (RLUSD), whose assets have jumped to $91 million. Including Ethereum, the RLUSD stablecoin has gained over $789 million in assets.
The XRP Ledger is performing well in the RWA industry, with total assets increasing by 11% over the last 30 days to $361 million. This makes it the tenth-biggest chain in crypto.
READ MORE: Zcash Price Prediction: Why ZEC Jumped and Why it May Crash Soon
XRP price will also benefit from the ongoing ETF inflows. Data shows that the REX-Osprey XRP ETF (XRPR) has accumulated over $87 million in assets, while the Teucrium 2x XRP ETF (XXRP) has accumulated over 440 million in assets.
This growth is a sign that there is a strong demand for XRP from American institutional investors, who now believe that top cryptocurrencies have become viable alternative assets. As such, there is a likelihood that the upcoming XRP ETFs will have strong inflows after their approval later this month.
XRP price is also set to benefit from the Uptober rally, which has already pushed Bitcoin price to a record high. It is common for Bitcoin and most tokens to experience significant price increases in October and the fourth quarter.
XRP Price Technical Analysis
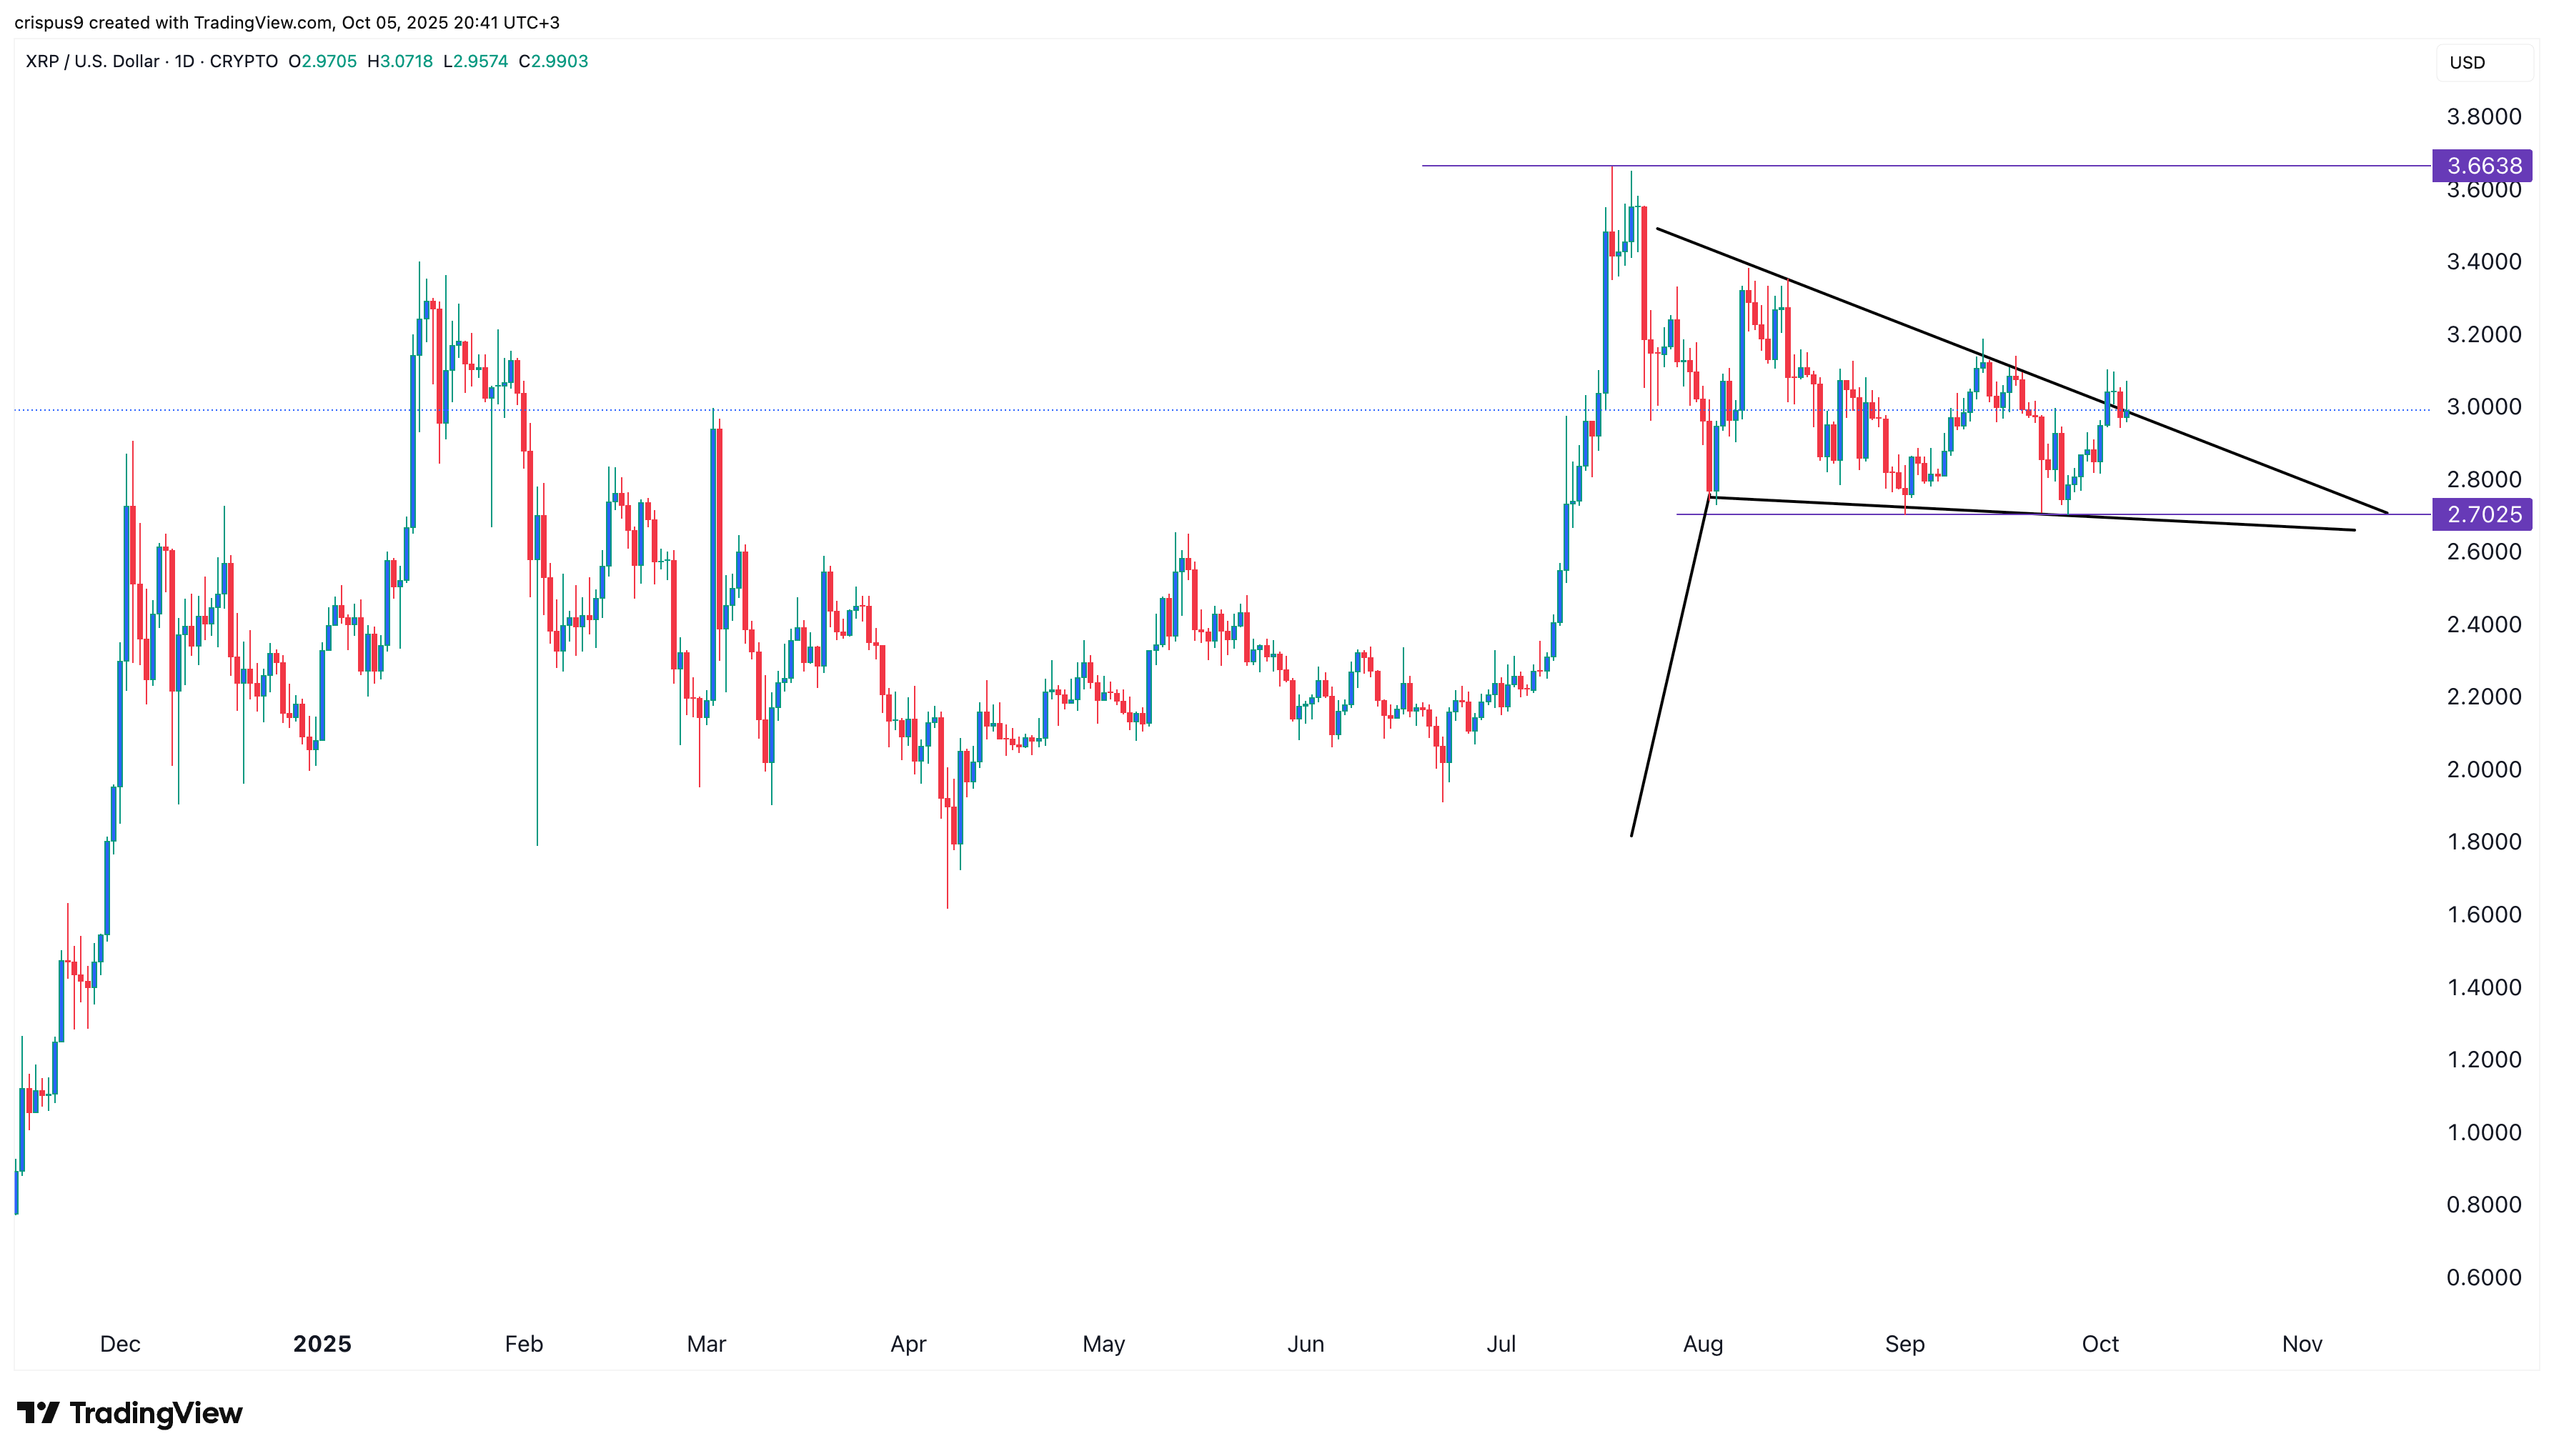
The daily timeframe chart shows that the XRP price has plunged from the year-to-date high of $3.6638 to the current $3. It has formed a few bullish chart patterns, pointing to an eventual breakout.
For example, it has formed a falling wedge pattern, consisting of two descending and converging trendlines that are now nearing their confluence.
The most notable aspect of this pattern is that it occurs after the coin has jumped, indicating that it has formed a bullish pennant pattern, a common continuation pattern. It is also in the midst of an Elliot Wave pattern.
Therefore, the most likely scenario is one where the coin stages a strong rebound and possibly hits the year-to-date high of $3.60, up 23% above the current level. A move above that resistance will point to more gains, potentially reaching the psychological level at $5. A drop below the support at $2.70 will invalidate the bullish XRP price forecast.
READ MORE: XRP Price Crashes Today—Is This the Last Dip Before a Major Rally?