


HBAR price has crashed into a bear market this month, and the situation may worsen as it is about to form a death cross pattern on the daily chart. Hedera Hashgraph token was trading at $0.1790, down by 40% from its highest point in July 2025.
Hedera Hashgraph Ecosystem Challenge Remain
HBAR is one of the biggest players in the crypto industry with over $7 billion in market capitalization. It is known for its significant partnerships with companies like Google, Ubisoft, IBM, and LG.
Many crypto analysts believe that Hedera has the potential to disrupt the crypto industry because of its fast speeds, low transaction costs, and enterprise-scale governance.
However, a closer look at its ecosystem shows that it is not living up to the hype. For example, data compiled by DeFi Llama shows that Hedera has just 20 DeFi dApps in its ecosystem. Only 7 of these dApps have a TVL of over $1 million. Just Stader and SaucerSwap have a TVL of over $50 million.
READ MORE: Ethereum Price Prediction: Top Reasons ETH is About to Soar
DeFi TVL is not always the best measure for a blockchain’s activity. One of the most important measures for a layer-1 or layer-2 chain is its activity in the decentralized exchange industry. Data shows that Hedera’s network handled just $13 million in DEX volume in the last 24 hours, while Ethereum and Solana handled billions.
Another measure is the amount of stablecoins in the ecosystem. Hedera has just $89 million in stablecoins assets, a tiny amount for an industry with over $306 billion in circulating supply.
The USD Coin supply in Hedera stands at about $89 million, with the rest being Hedera Swiss franc and XSGD stablecoins. Hedera’s stablecoin supply is notable because the network was not recently selected as the only chain for Wyoming’s stablecoin, FRNT. Also, Hedera runs Stablecoin Studio, whose goal is to simplify the creation of stablecoins.
HBAR Price Technical Analysis
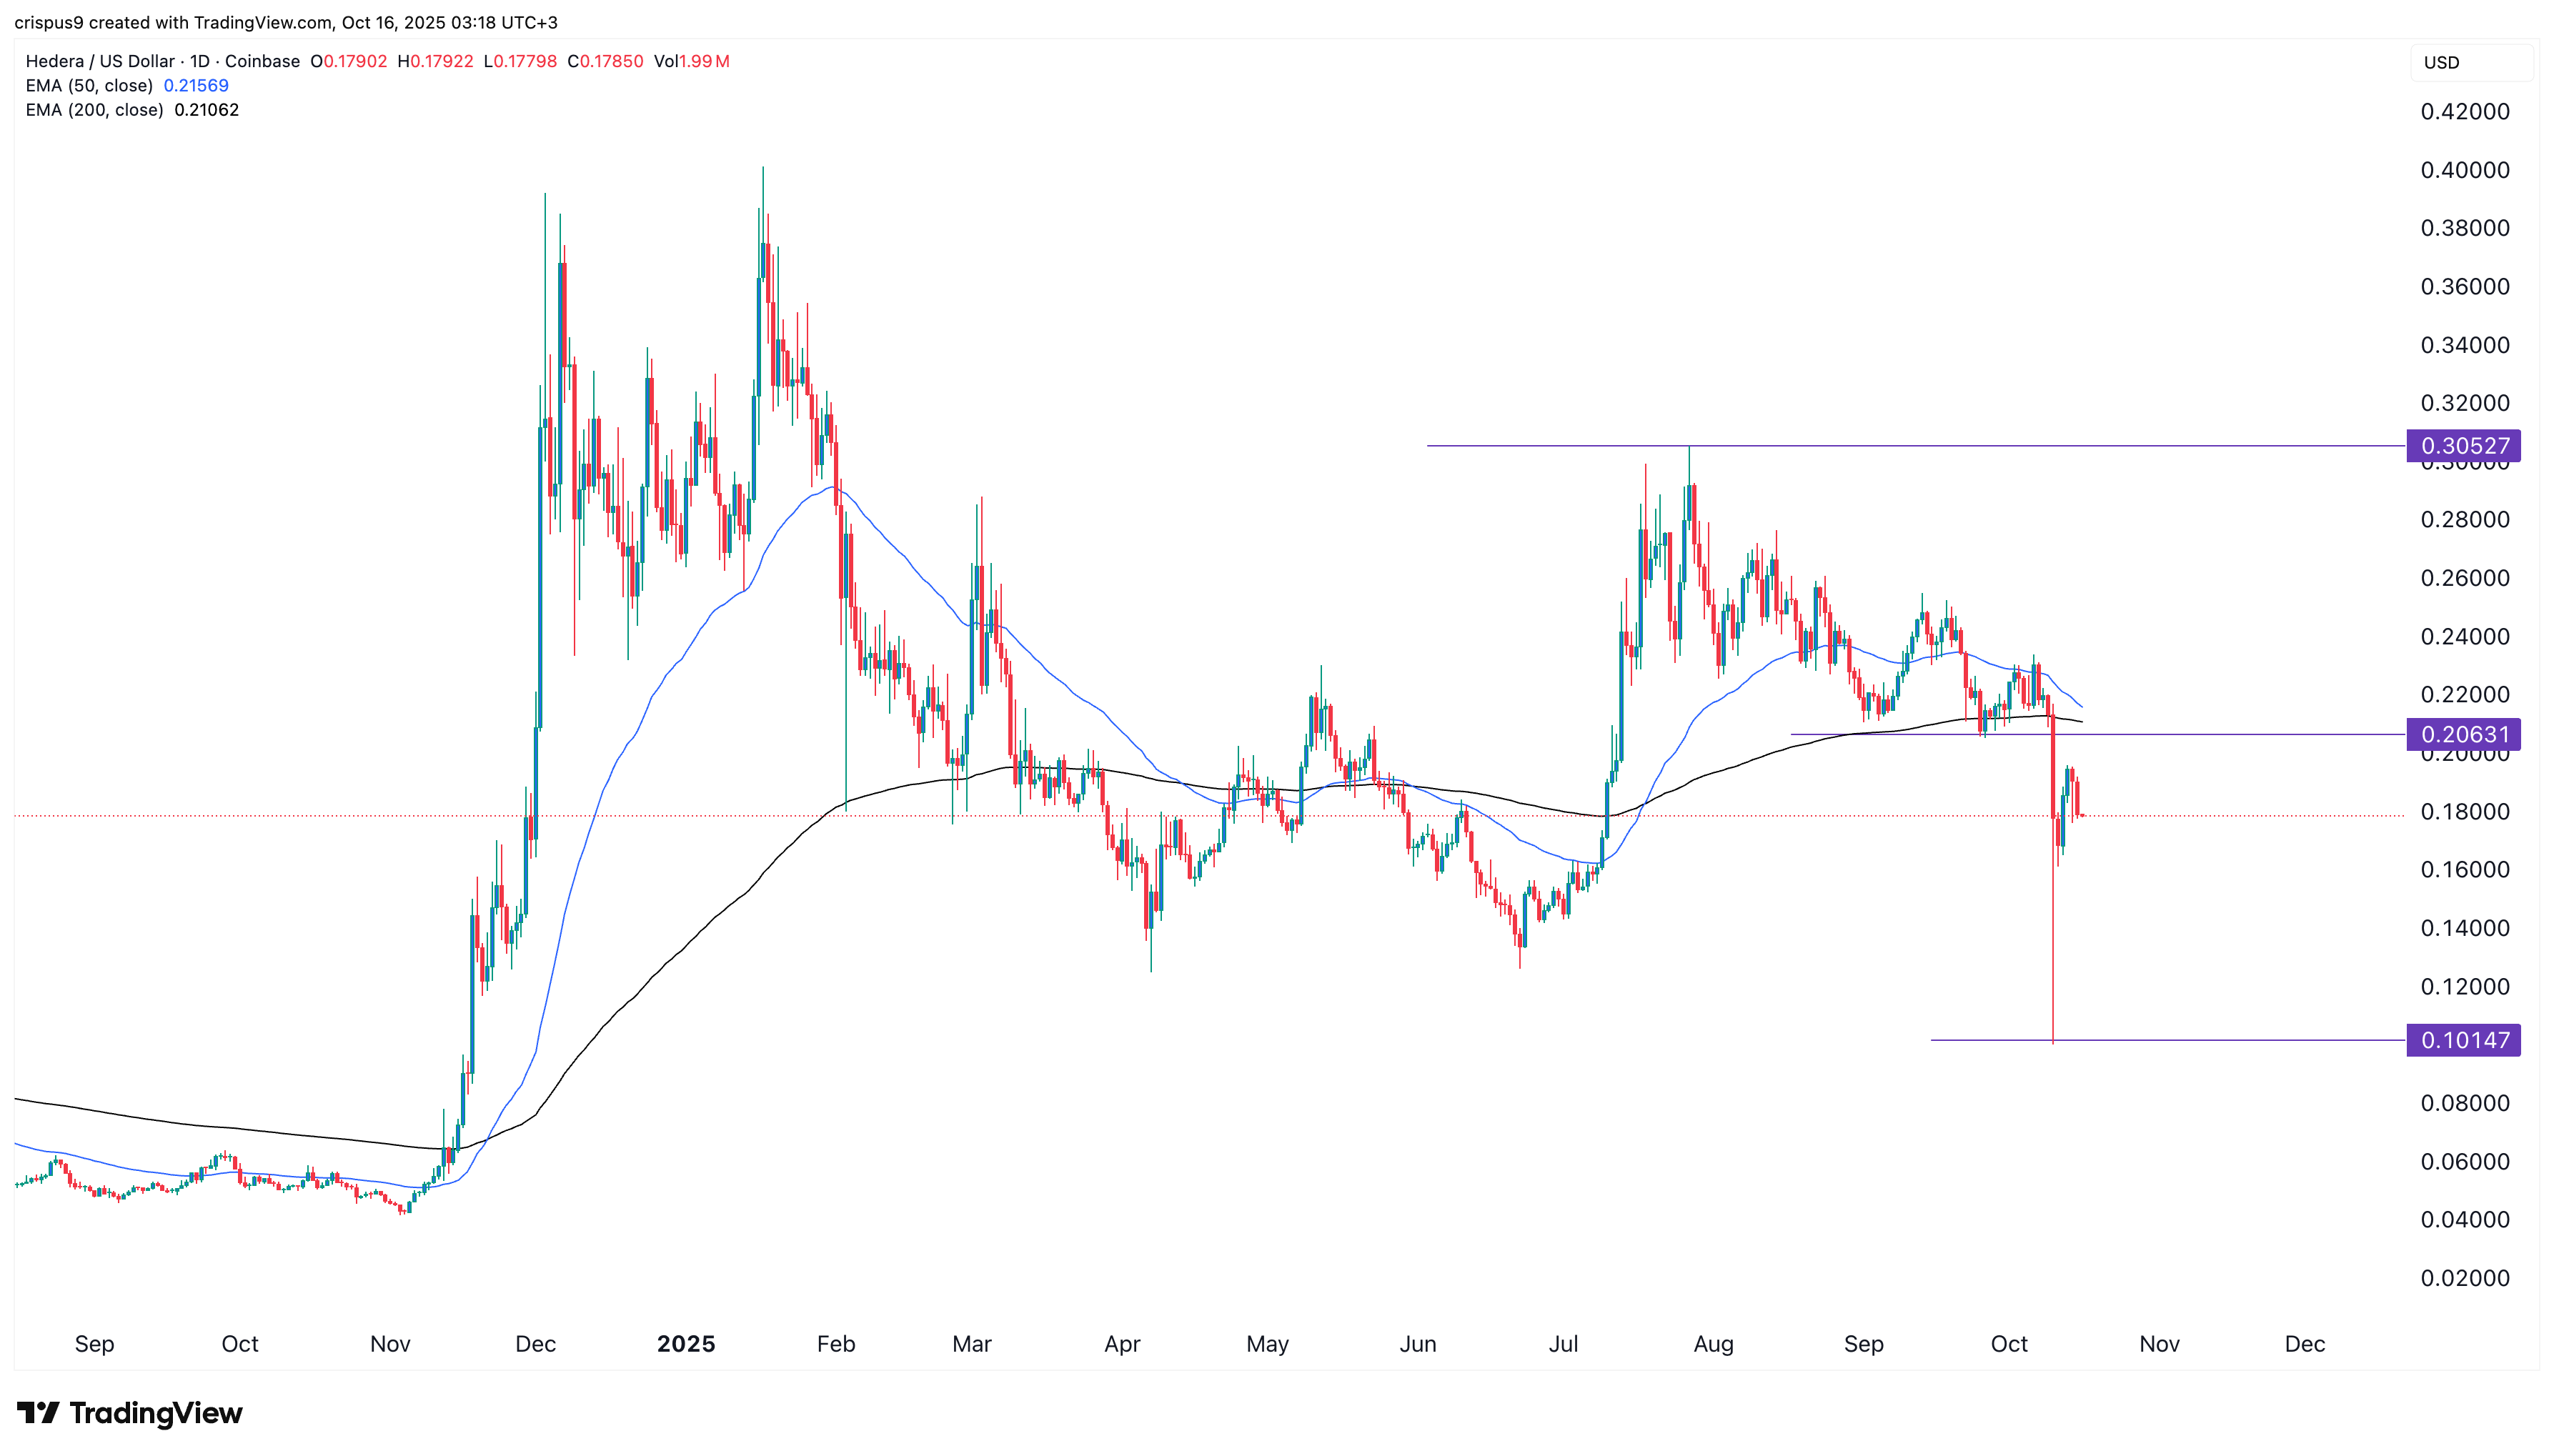
The daily timeframe chart shows that the HBAR price peaked at $0.3052 on June 26 and then crashed to the current $0.18.
It has moved slightly below the important support level at $0.2063, where it recently formed a double-bottom pattern.
The coin is about to form a death cross pattern, which often leads to more downside. This pattern is made up of a 50-day and 200-day Exponential Moving Average (EMA) crossover.
Therefore, the token will likely continue falling as sellers target the next key support level at $0.1015, its lowest level on Friday.
READ MORE: Pi Network Price Technical Analysis: Is it Safe to Buy Today?