

Morpho price (MORPHO) joined Friday’s list of top decliners, sliding nearly 15% to $1.68 within 24 hours as risk appetite across DeFi dried up. The drop wiped more than $100 million from its market cap, despite a 12% rise in trading volume, a sign of aggressive selling pressure rather than renewed interest.
For now, the move looks less like panic and more like rotation. While Bitcoin price dropped below $105,000, altcoins, particularly mid-cap DeFi names, were hit hardest as liquidity retreated from higher-risk protocols.
Why MORPHO Price Is Falling Today
The broader market backdrop isn’t helping. Total crypto market capitalization is down 5.67% in 24 hours to around $3.5 trillion, and the Fear & Greed Index has plunged to 28, “Extreme Fear.”
Morpho’s slide comes right after a parabolic 200% rally earlier this month, partly fueled by the Ethereum Foundation’s 2,400 ETH ($9.6M) deposit into Morpho’s vaults on October 15. The price topped out at $2.03 shortly afterward, a textbook setup for profit-taking once that initial hype cooled.
READ MORE: Uniswap Unveils Support for Solana on its Web App
DefiLlama data shows that TVL is holding above $11.2B, but daily fees have dropped sharply to $662K, suggesting that activity may be slowing. On-chain figures also reveal about 2,500 daily active addresses, a decent number for a lending protocol, but not enough to offset macro fear and short-term traders exiting positions.
It’s not the first time whales have tested the market’s patience after a sharp run. On-chain liquidity sits near $6.5M, a modest buffer for a token with over $850M in market cap. That imbalance can easily amplify volatility when order books thin out, and that’s exactly what appears to have happened here.
Eyes on $1.60 Support as $MORPHO Tests Market Patience
Technically, the picture leans bearish in the short term. MORPHO price broke below its 38.2% Fibonacci retracement at $1.77, confirming a loss of near-term structure. The MACD is barely holding positive territory, a setup often seen before another leg lower.
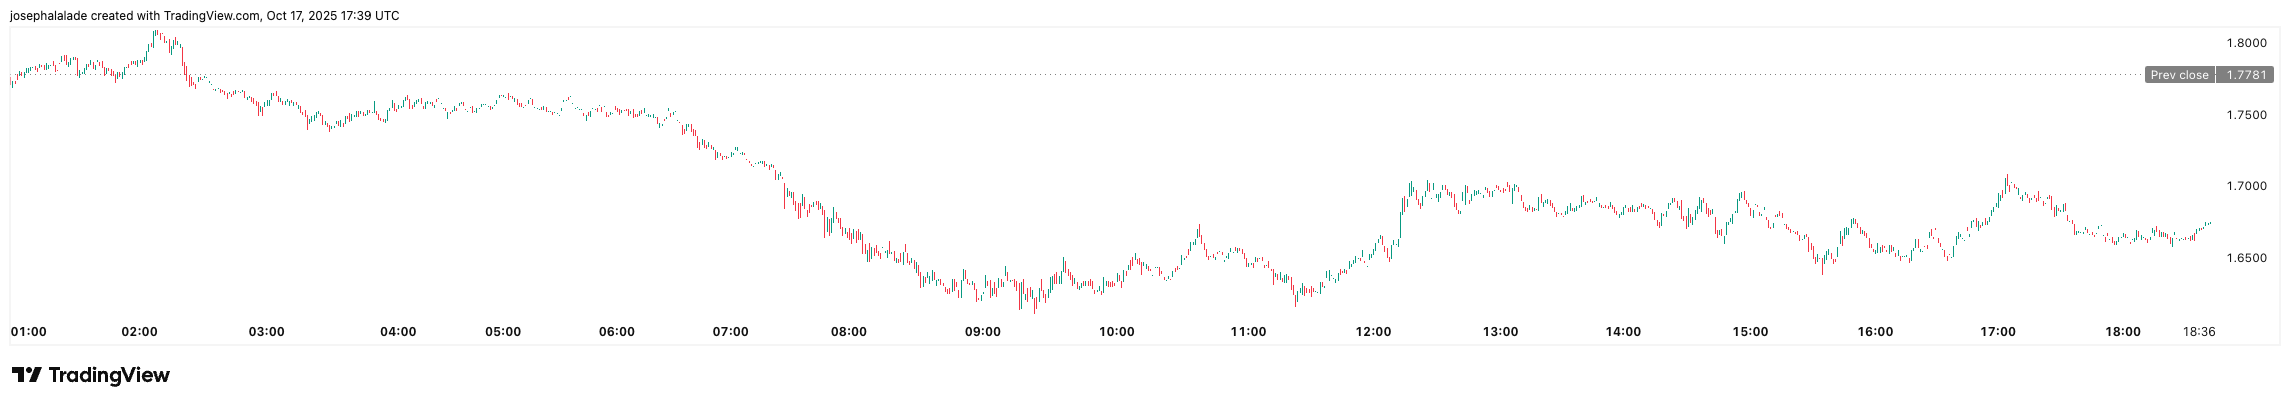
Moving averages on the daily chart flash 13 sells vs. 1 buy, giving a clear “Strong Sell” signal on TradingView. The 50-day SMA at $1.82 now acts as resistance, followed by heavier resistance around $2.00, which capped last week’s rally. Support rests at $1.60, and a breakdown below could expose $1.45–$1.50 zones.
That said, a bounce from oversold levels can’t be ruled out. Volume-to-market-cap remains high (roughly 15%), suggesting active participation rather than a dead market. A reclaim of $1.80 would quickly flip sentiment, but without fresh catalysts or TVL inflows, rallies are likely to fade fast.
READ MORE: Chainlink price Supertrend Turns Red Despite Rising LINK Reserves