


Shiba Inu price has been in a strong downtrend this year. It has wiped out billions of dollars in value, with its market capitalization moving to $6 billion. This article explains why the SHIB token has plunged and what to expect.
Why Shiba Inu Price Has Crashed
There are a few reasons why Shiba Inu price has crashed and erased billions of dollars. First, the plunge is in line with the ongoing sell-off in Ethereum meme coins. A closer look shows that all ETH meme tokens like Pepe, Dogelon Mars, and Baby Doge Coin shows that they have all plunged and underperformed the crypto industry.
Second, Shiba Inu price has plunged because of its ecosystem woes. Data shows that Shibarium’s total value locked (TVL) has plunged below $1 million. While this TVL dropped further after the recent ShibaSwap hack, the reality is that it has never been a popular chain.
READ MORE: Chainlink price Supertrend Turns Red Despite Rising LINK Reserves
Third, SHIB price has plunged because of the recent whale and smart money selling. Whales now hold 117 billion tokens, down from the October high of 231 billion. Smart money investors’ holdings have fallen by 9.45% in the last 90 days.
Shiba Inu price has also imploded as the meme coin industry has become highly saturated. Most of this saturation has been in the Solana ecosystem, where users have minted thousands of tokens such as Official Trump, Pudgy Penguins, Bonk, and Dogwifhat.
Further, SHIB’s demand has faded, with the daily volume remaining deeply under pressure. Its 24-hour volume was $264 million, lower than most tokens. Similarly, the futures open interest of the SHIB token has continued falling this year.
SHIB Price Technical Analysis
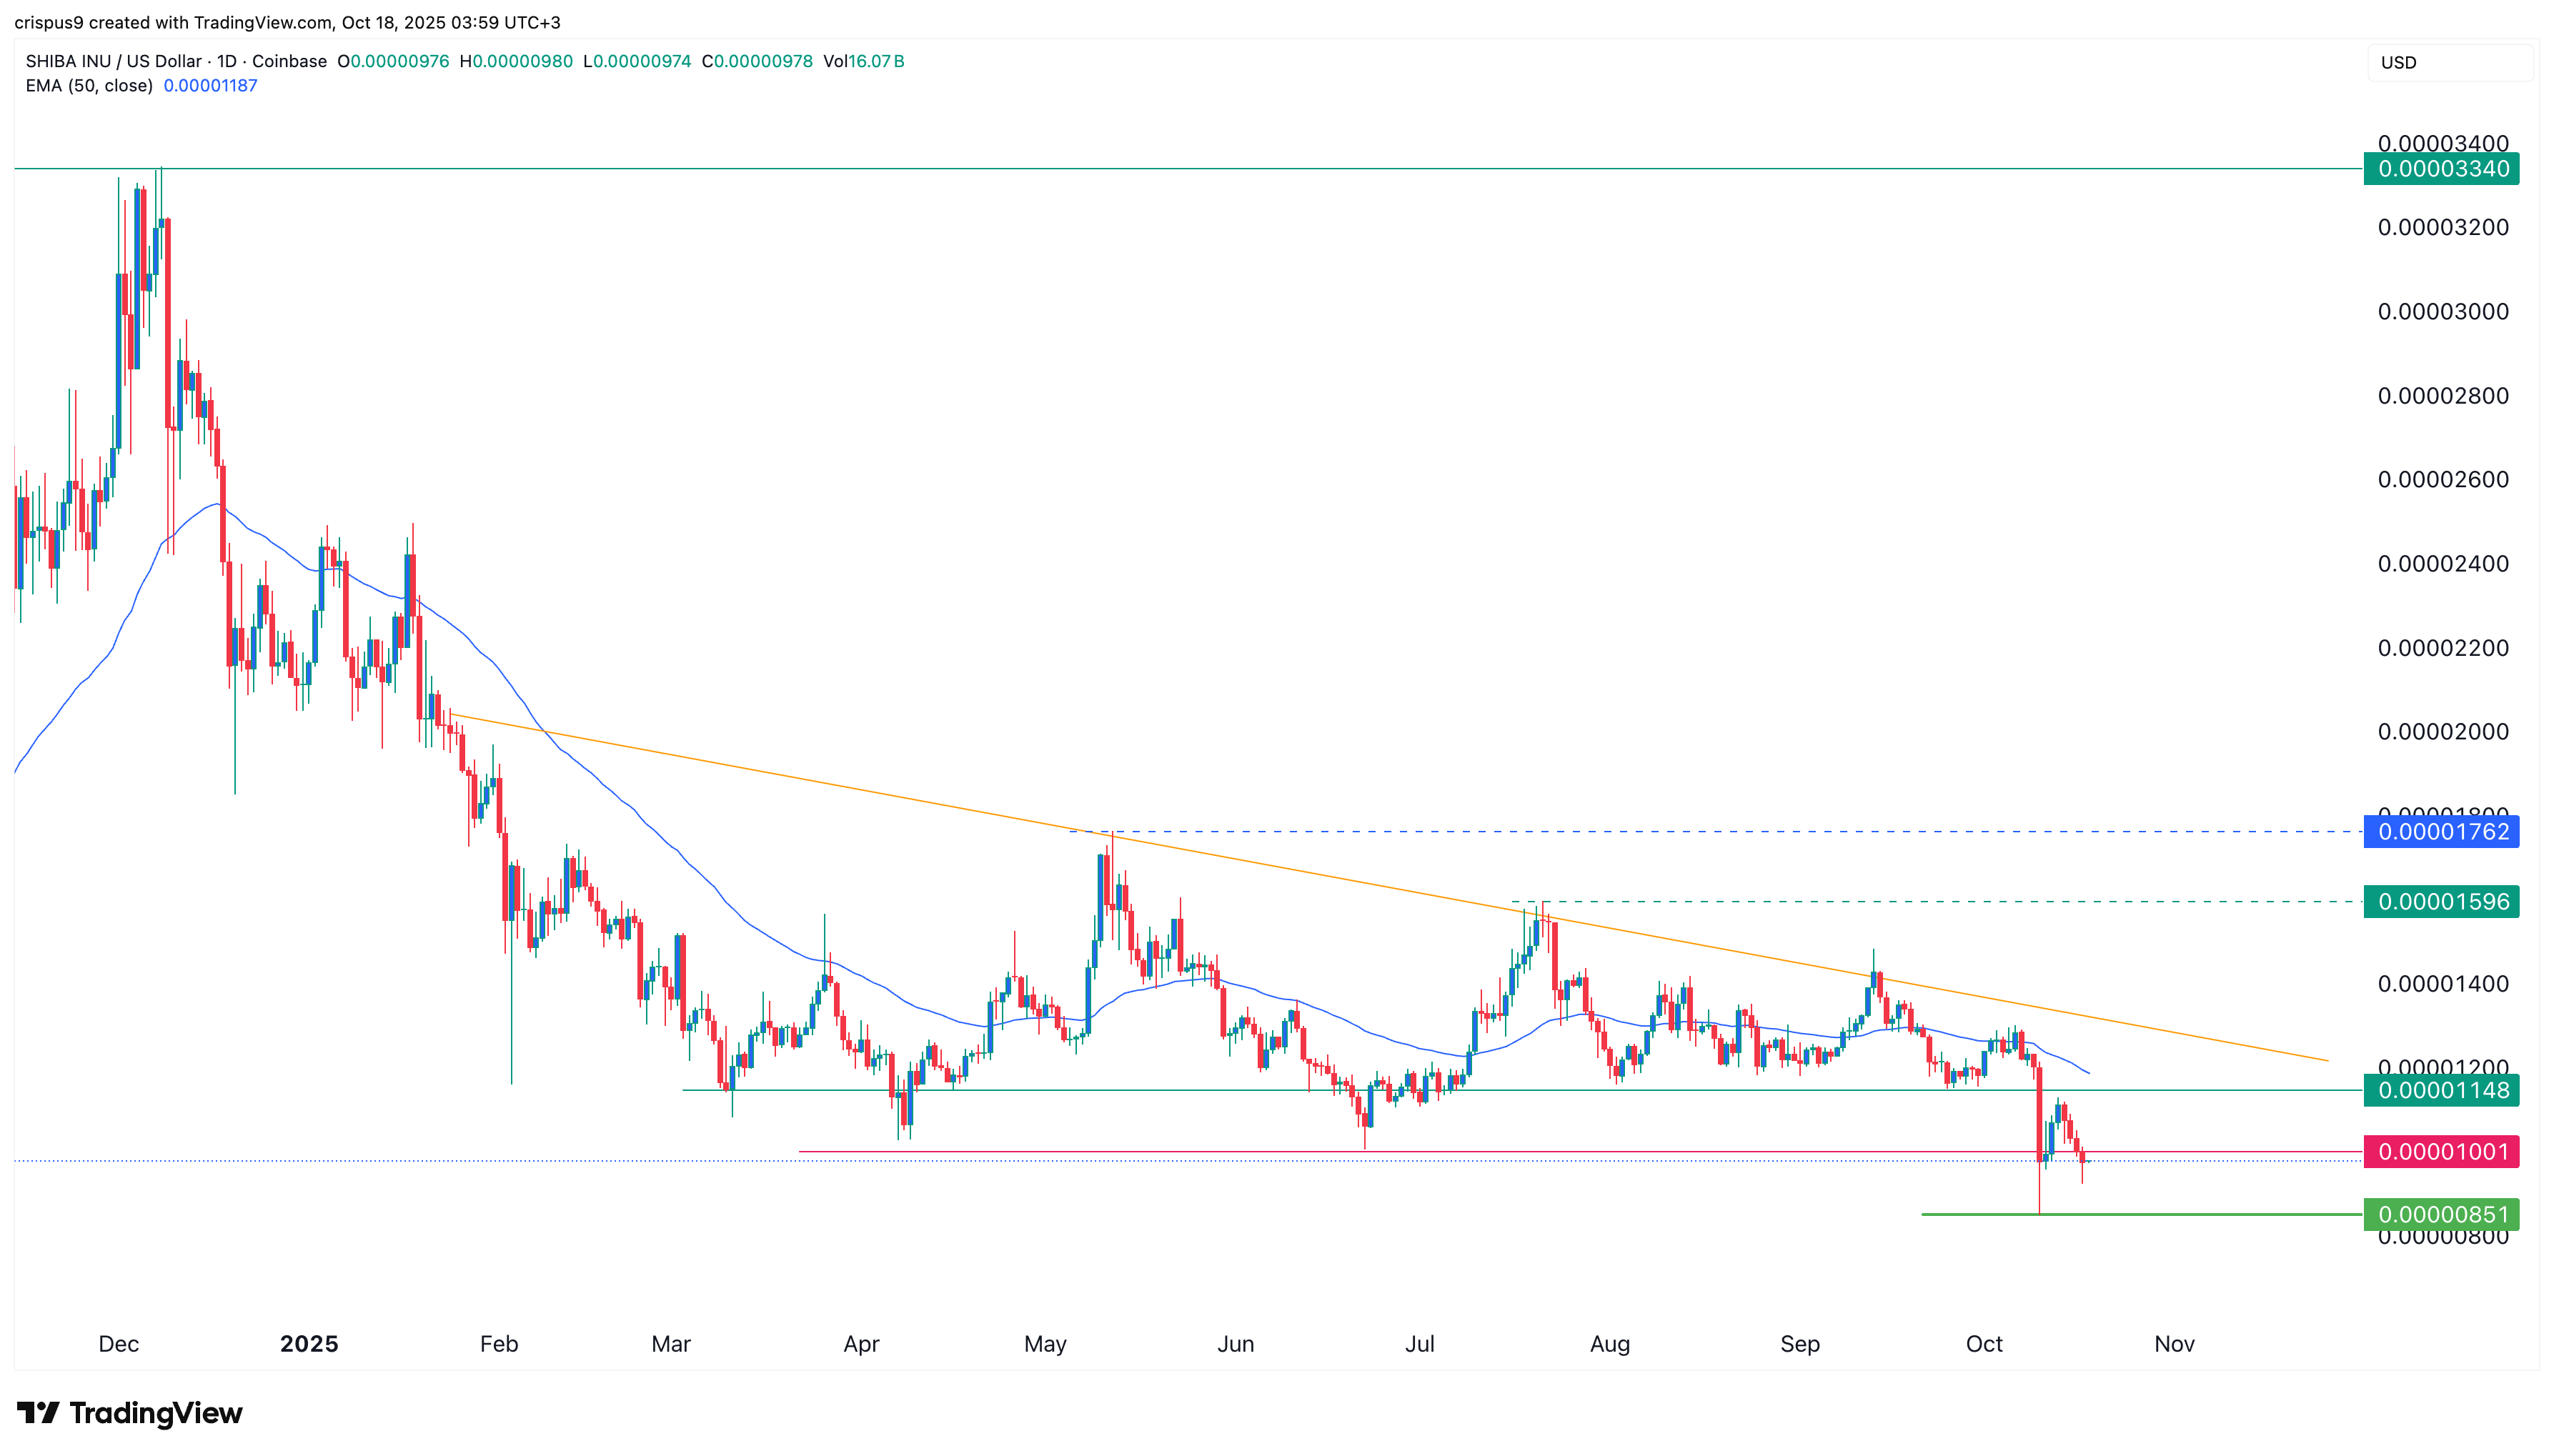
Shiba Inu price chart | Source: TradingView
Technical analysis has also contributed to the ongoing crypto market sell-off. The daily chart shows that the token’s price has plunged from a high of $0.00003340 in November last year to $0.00000979 today.
SHIB has remained below all moving averages and the Supertrend indicator. It also tumbled below the key support at $0.00001148, the lower side of the descending triangle pattern, a popular bearish continuation sign. It has also moved below the 50-day and 100-day Exponential Moving Averages (EMA).
All its attempts to bounce back have faced substantial resistance this year. Therefore, the most likely scenario is where the SHIB price continues falling as sellers target the key support at $0.0000085, the lowest level this month. A move below that level will point to further downside this year.
READ MORE: Here’s Why Bitcoin Price, S&P 500, Dow Jones are Falling as Gold Rises Today