


FLOKI Coin is back in the spotlight again, thanks to Elon Musk. The meme coin spiked more than 22% in 24 hours, hitting $0.000083 after Musk posted a Grok-generated clip of his Shiba Inu with the caption, “Flōki is back on the job as X CEO.”
Within hours, trading volume ballooned by over 700%, pushing daily turnover past $460 million and vaulting FLOKI Coin into the #1 trending spot on CoinGecko.
It’s the kind of reflexive surge that’s become signature Musk; one tweet, and retail traders pile in. FLOKI’s market cap now sits around $793 million, briefly overtaking several small-cap DeFi tokens.
Still, traders are split. Some see this as a rerun of the Dogecoin (DOGE) playbook from 2021. Others warn it might be another short-lived burst of speculative euphoria.
FLOKI Coin Rips Higher After Elon Musk’s Latest Tweet
The obvious catalyst is Elon Musk himself. But under the hood, data shows the move wasn’t purely emotional. According to data, open interest and derivatives volume have jumped triple digits, a sign that leverage traders are betting aggressively on continued upside.
FLOKI’s 24-hour volume-to-market-cap ratio now exceeds 50%, signaling extreme activity across spot and perpetuals.
READ MORE: Top 5 Reasons Why XRP Price May Spark Higher Soon
While FLOKI’s fundamentals haven’t changed overnight, speculative flows are clearly rotating back into dog-themed assets. With Dogecoin and Shiba Inu trading relatively flat, Floki Crypto is now the meme coin proxy for Musk-related momentum.
FLOKI Price Analysis: Can the Rally Continue?
From a technical standpoint, FLOKI’s chart tells a familiar story. The $FLOKI token broke through short-term resistance near $0.000067, accelerating into a clean breakout above $0.000080.
Momentum indicators like the RSI (51) and Stochastic (93) remain neutral to slightly overheated, suggesting there’s room for continuation but not without volatility.
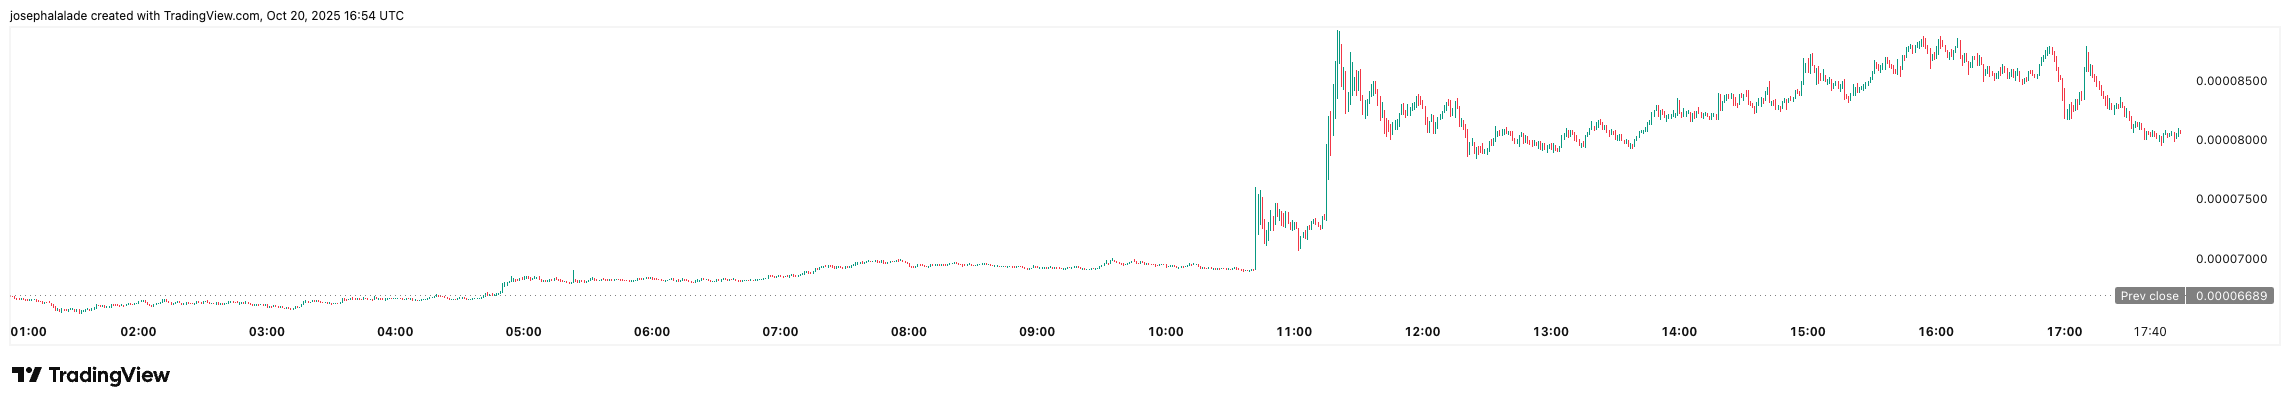
Immediate resistance now sits between $0.000085–$0.000090, where previous rallies failed to sustain. A decisive close above $0.000090 could open the door to $0.00010, a psychological milestone that hasn’t been seen since early October.
On the downside, the 200-day moving average near $0.000067 remains key support. A break below that could invalidate the short-term bullish structure and trigger profit-taking, especially if social hype fades.
For now, though, technicals lean cautiously bullish. The moving average summary shows 7 buys vs. 8 sells, reflecting indecision, but also the potential for a squeeze higher if momentum persists.
READ MORE: Can AI Beat the Market? Alpha Arena’s Live Trading Showdown Put Six Models to the Test