


HBAR price rose slightly as the crypto market jumped after the latest US consumer inflation report. Hedera token was trading at $0.1700, up from last week’s low of $0.1552. This rebound also coincided with the growth of stablecoins in the network.
Hedera Stablecoin Growth Resumes
One major catalyst for HBAR’s price is that stablecoin growth on Hedera Hashgraph has continued this week. The stablecoin supply has jumped to over $170 million, its highest level since August.
This growth was driven by USD Coin (USD), whose assets have jumped by 98% to $170 million in the last 30 days. While this is good news for Hedera, a closer look at its stablecoin assets shows they have been behaving oddly over the past few months.
READ MORE: Bitcoin Price Prediction Ahead of US Inflation Data: Buy or Sell?
For example, the stablecoin assets jumped to $212 million on May 27 and then crashed to $76 million on May 29. They then soared from $59 million on June 24 to $224 million on August 1. A day later, they crashed to $65 million. Therefore, it will not be a surprise if the figure dips again soon.
HBAR price also stabilized after the Hedera Foundation sent 250 million tokens to the staking account. This transaction will enable institutional and retail investors to earn income by staking their tokens. Data shows that Hedera’s staking yield has jumped to 2.5%.
Still, Hedera’s network faces major challenges. One of the biggest ones is that it has not gained a substantial market share in the key industries in the crypto industry.
For example, Hedera has a total value locked (TVL) of less than $200 million despite its strong features and partnerships. It also a small presence in the booning RWA industry. Hedera has struggled in the NFT and DePIN industries, which explains why it is often seen as a ghost chain.
HBAR Price Technical Analysis
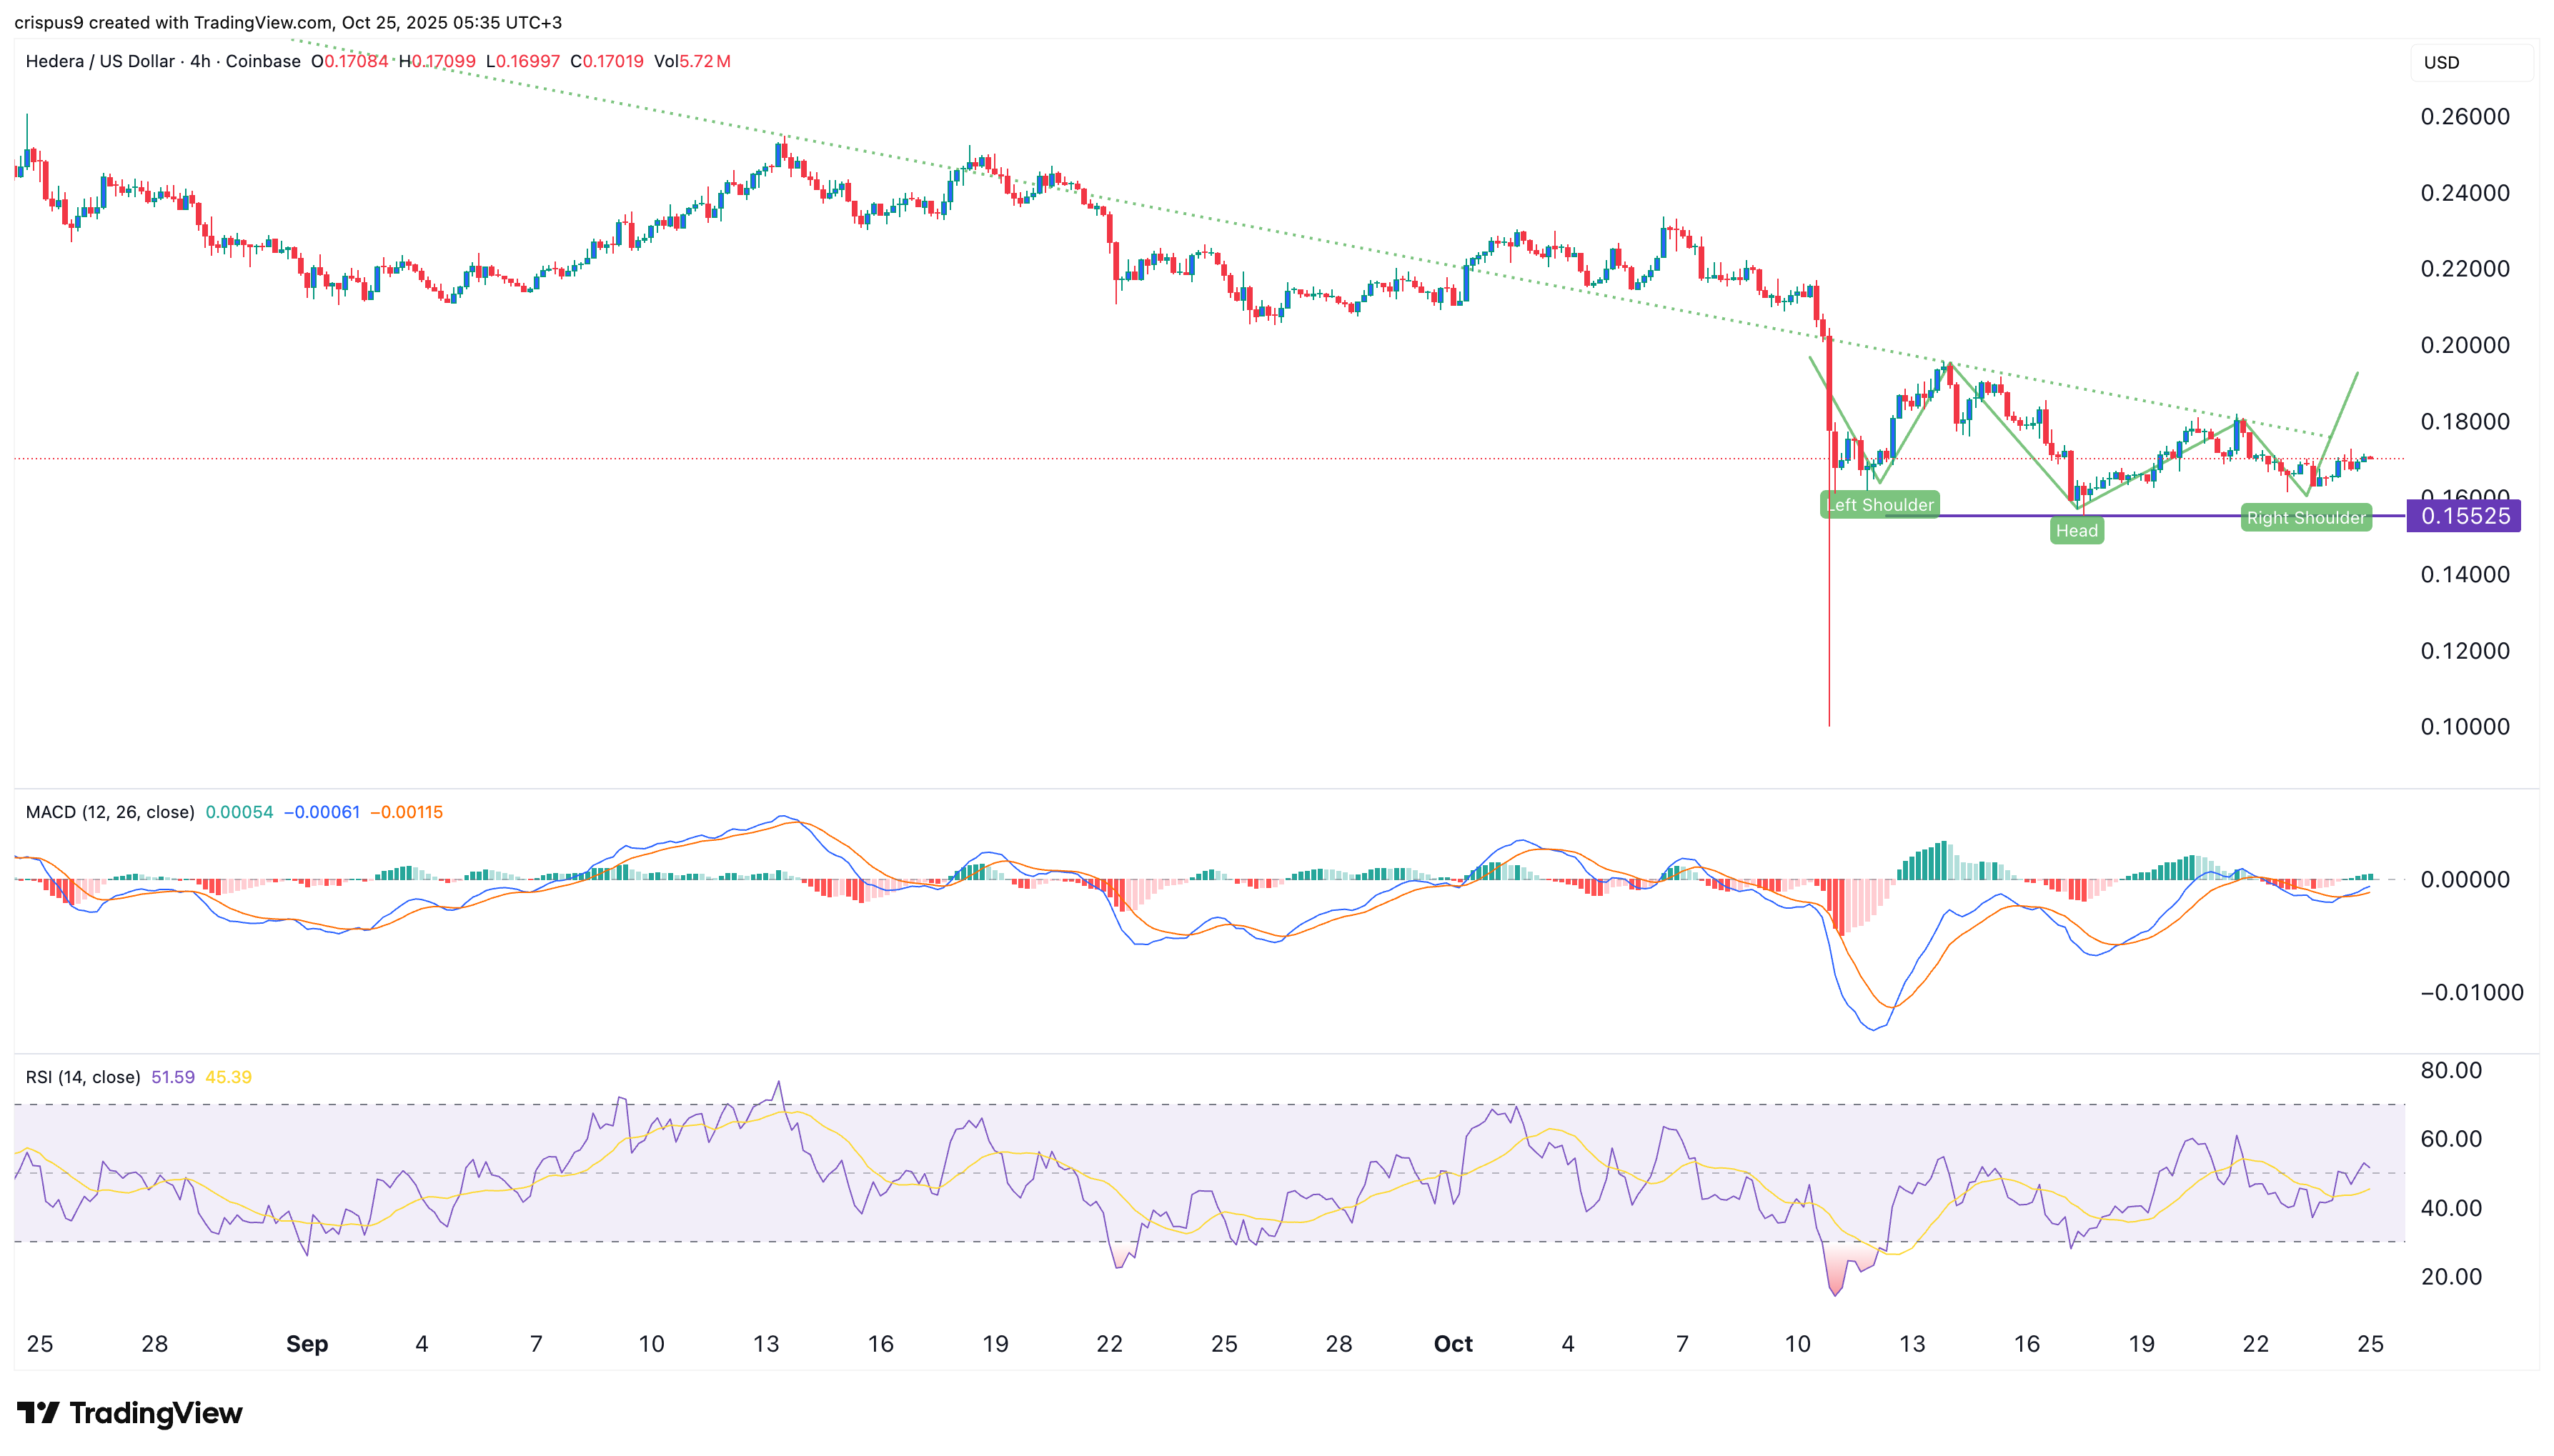
The four-hour chart shows that the HBAR price has remained in a tight range in the past few days. On the positive side, the token has formed an inverse head-and-shoulders pattern on the four-hour chart.
Oscillators such as the Relative Strength Index (RSI) and the MACD have continued to point upwards. It is also about to move above the 50-period moving average.
Therefore, the token will likely have a strong bullish breakout, with the next key point to watch being at $0.20. A move below the support at $0.1525 will invalidate the bullish view.
READ MORE: Top 3 Reasons Why Ethereum Price Could Go Parabolic Soon