


Tron price has crashed over the past few weeks, falling from a high of $0.3683 in August to $0.2956 today, its lowest level since July 11. The TRX token has plunged 20% from its year-to-date high and has formed a death cross, signaling further downside.
Tron Price Technical Analysis
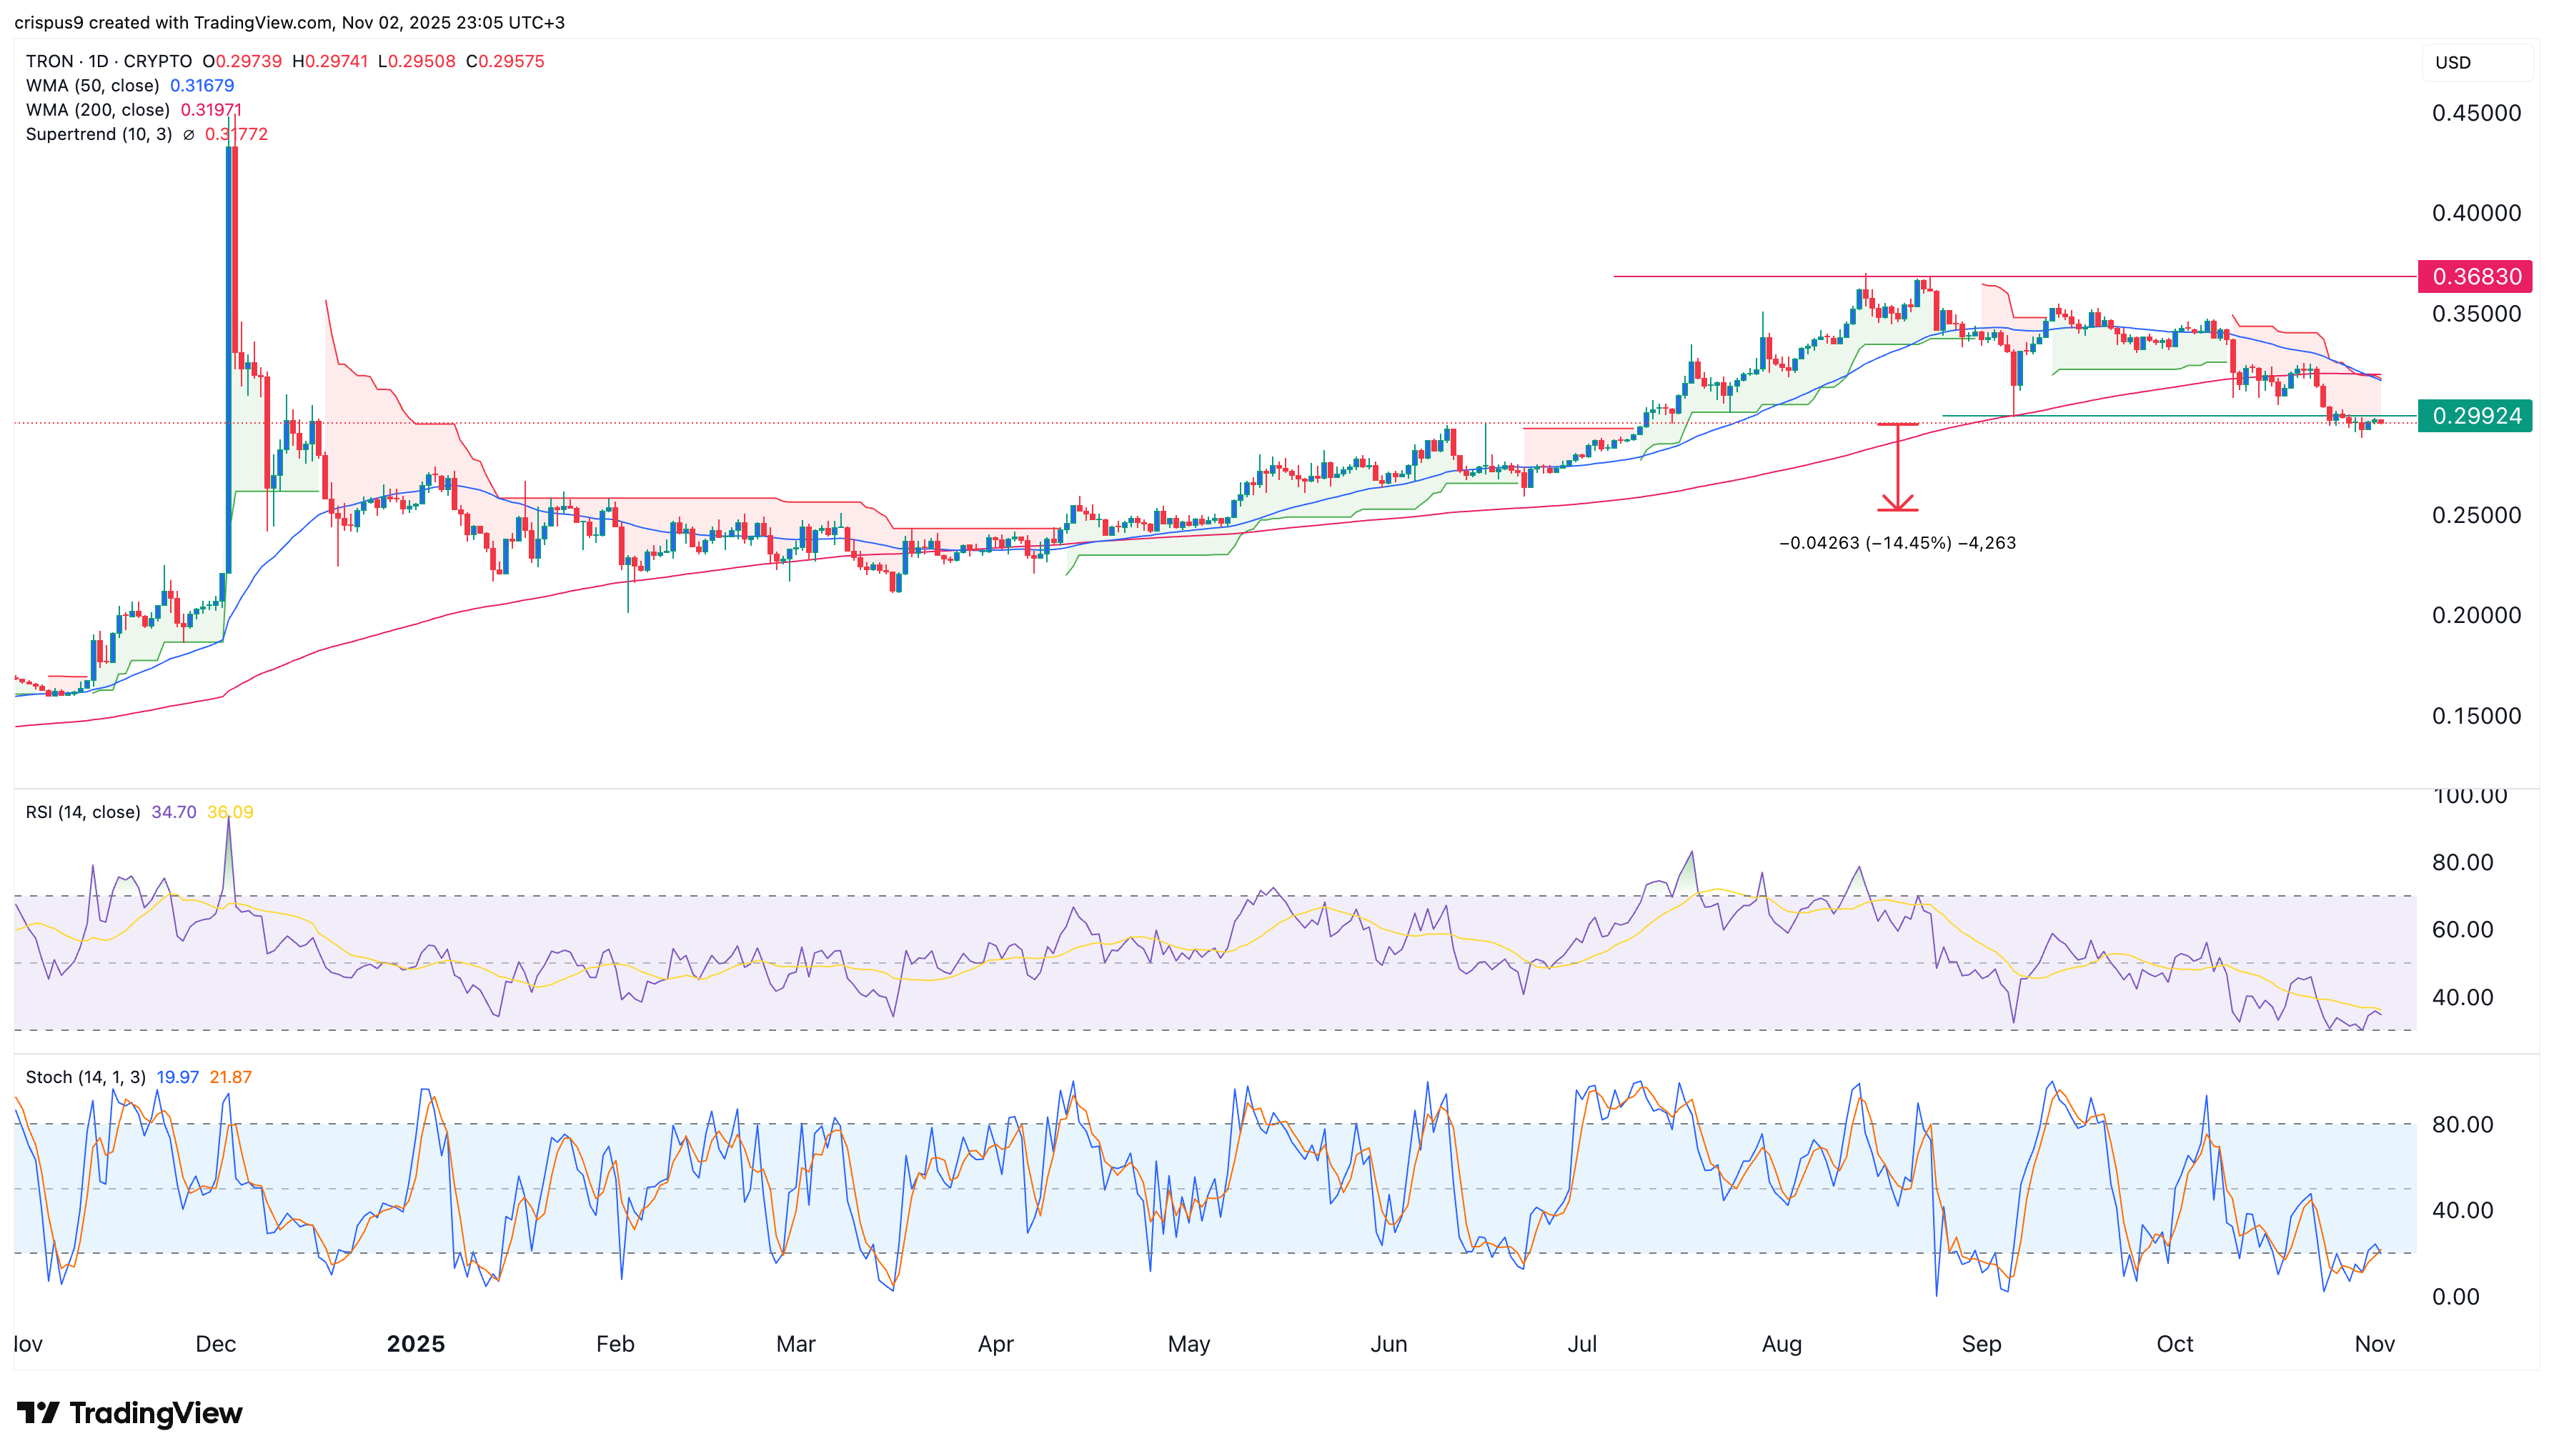
The daily timeframe chart shows that the TRX price peaked at $0.3683 and then fell to $0.2960. It has moved below the important support at $0.300, its lowest point on September 6 this year.
Tron has also formed a death cross pattern, as the 50-day and 200-day Weighted Moving Averages (WMA) crossed. This is one of the most common bearish patterns in technical analysis.
Furthermore, Tron price has moved below the Supertrend and the Ichimoku cloud and indicator. Moving below the two indicators is a sign that bears are in control.
READ MORE: XRP Price Prediction After Fed Interest Rate Cut: Buy the Dip?
The Relative Strength Index (RSI) and the Stochastic Oscillator indicators continued falling. They are nearing the oversold level as the downtrend continues.
Therefore, the token will likely continue to fall in the near term as sellers target the key support level at $0.2500, which is about 15% below the current level. A move above the $0.3200 resistance will invalidate the bearish outlook.
TRX Price Crashes Despite Strong Fundamentals
The Tron price has plunged over the past few days despite strong fundamentals. Data shows that DEX volume jumped 174% over the last 30 days to over $3 billion.
More data shows that the network’s perpetual futures volume rose by 3.4% to $2.44 billion. Most importantly, the number of active addresses and transactions jumped to 87.72 million and 304.34 million, respectively, during this period.
One reason why this is happening is that it is a major player in the stablecoin industry. Data shows that the network processed over $74 billion in USDT transactions, with the number of holders rising to almost 70 million.
This growth will likely continue after the GENIUS Act is signed into law. More companies are also embracing stablecoins, with the latest being Revolut, which has over 45 million users.
The other notable catalyst for the Tron price is the potential approval of the Canary TRX ETF. This approval will likely boost its price when it happens.
READ MORE: HBAR Price Prediction as Hedera ETF Sees Strong Demand