


Bitcoin price bounced back to over $104,000 on Thursday, as investors bought the dip following the recent crash. BTC was trading at $104,000 at press time, boosting the crypto market’s performance. So, is this the end of the Bitcoin crash?
Why Bitcoin Price is Rising
There are a few reasons why the BTC price is rising today. First, and most importantly, the ongoing Bitcoin price rebound is likely a dead-cat bounce, a situation in which a falling asset bounces back temporarily before resuming its downtrend.
In this case, the coin was down 21.6% from its year-to-date high, indicating it was in a technical bear market. As a result, some traders believed it was a bargain and started buying.
Second, the coin crashed because of the latest Supreme Court hearing on Donald Trump’s tariffs in the United States. Traders anticipate that the court will rule in favor of halting Trump’s tariffs, arguing that they constituted a big tax increase.
Still, it is worth noting that Trump has more tools in place to implement his tariff policy, including using the Section 301 powers given by Congress. In this, he can add tariffs after the administration conducts a study and finds that some countries have unfair trade practices.
READ MORE: Top Reasons Why the BitMine Stock Price Crash May Continue
Additionally, the Bitcoin price rose after the US published strong macro data. A report released by ADP showed that the private sector returned to growth, while additional ISM and S&P data pointed to a resilient service sector. These factors also explain why top stock indices like the S&P 500 and Dow Jones rose.
BTC Price Technical Analysis Points to More Downside
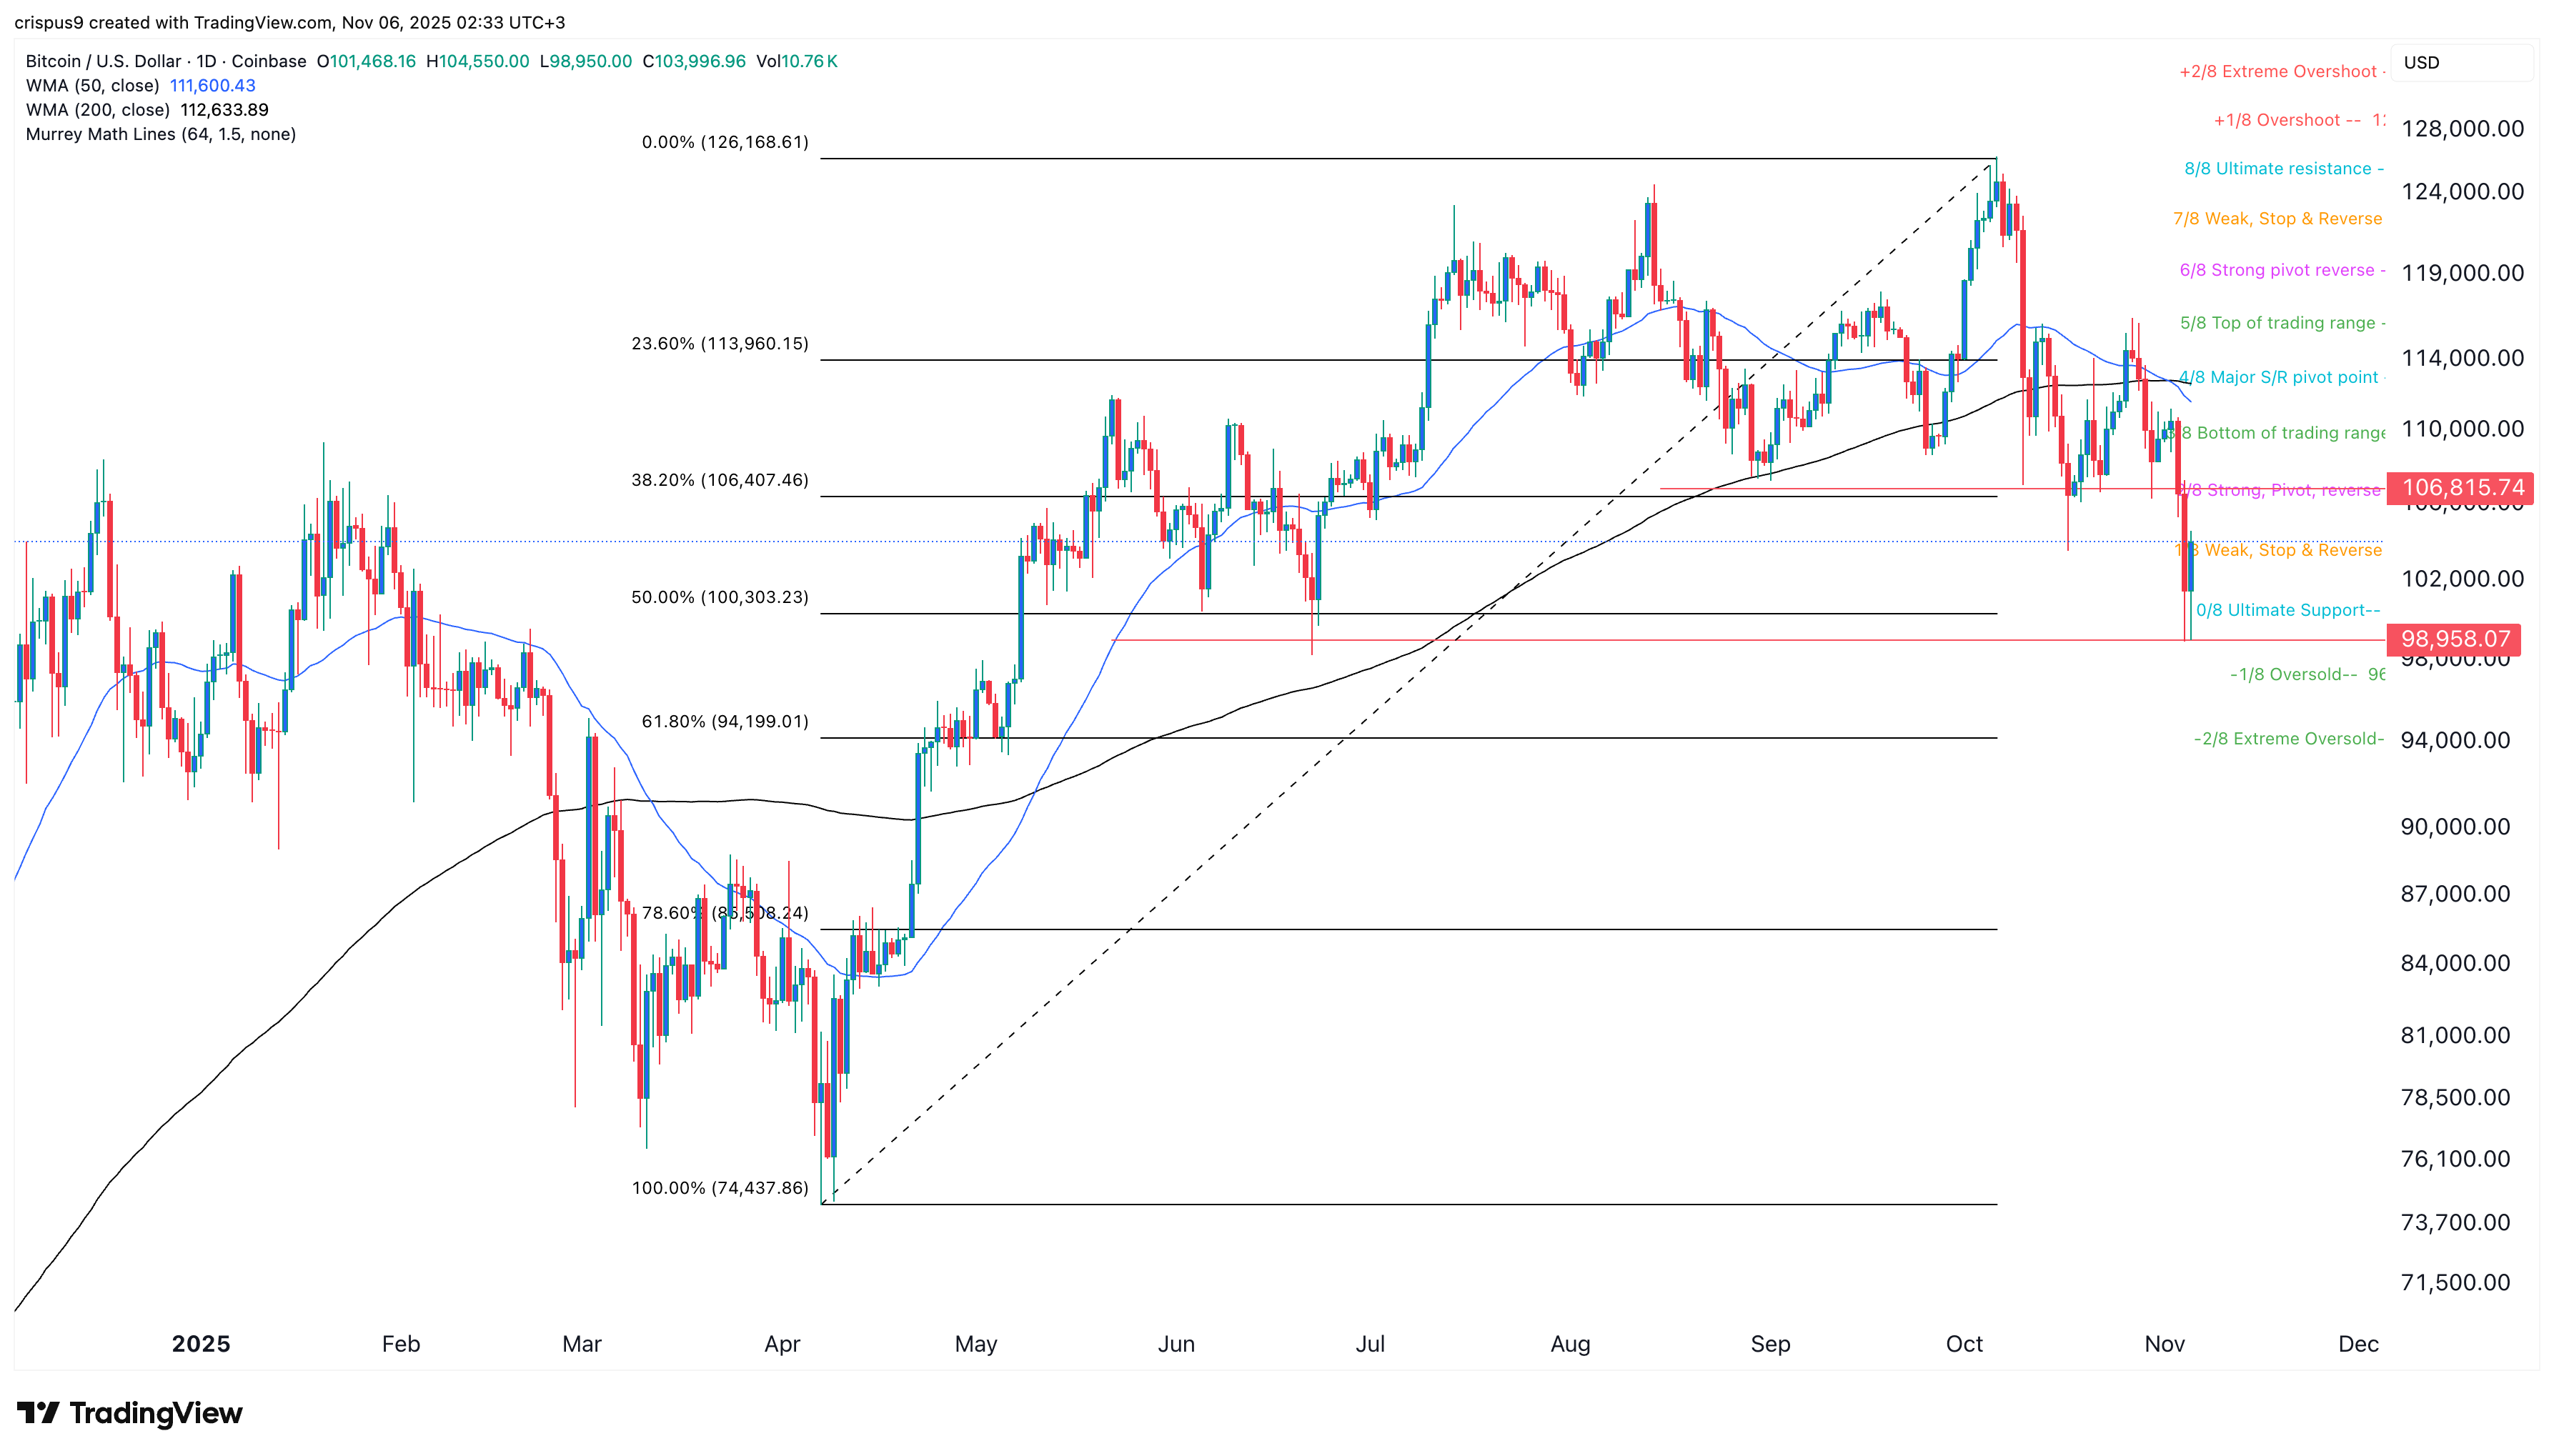
The daily timeframe chart shows that Bitcoin’s price has been steadily increasing over the past few weeks, rising from a record high of $126,170 in October to a low of $98,958.
Bitcoin has moved below the 38.2% Fibonacci Retracement level at $106,400, a sign that the bearish trend remains. It has also formed a death cross pattern, as the 50-day and 200-day Weighted Moving Averages (WMA) crossed.
Bitcoin’s rebound happened as the coin moved slightly below the 50% Fibonacci Retracement level at $100,000. It remains below the Ichimoku cloud indicator and the key resistance level at $106,815. This resistance is notable, as it coincides with the neckline of the double-top pattern at $124,273.
Therefore, the most likely scenario is where the ongoing Bitcoin rebound is a dead-cat bounce as it also remains below the Supertrend indicator, which is a highly bearish sign. The coin will likely continue falling, potentially to the 61.8% retracement level $94,200. This price aligns with the Murrey Math Lines tool’s extreme oversold level.
On the other hand, a move above the key resistance level at $106,815 will invalidate the bearish Bitcoin price forecast and signal further downside in the near term.
READ MORE: XRP Price Prediction as RLUSD Crosses $1 Billion Milestone