


XRP price remained on edge after the first spot ETF tracking the Ripple token launched, sparking substantial trading activity. Ripple was trading at $2.40 today, November 13, within a range it has traded in over the past few days. This price is a few points above this month’s low of $2.070.
XRP Price Wavers After XRPC ETF Launch
The Ripple token was relatively unchanged after Canary launched the XRPC ETF on the Nasdaq exchange. This fund became the second to track the XRP token, after the REX-Osprey XRP ETF (XRPR), which has already attracted over $120 million in assets.
The main difference between the two is that the XRPR ETF was launched using the Investment Act of 1940, while XRPC is part of the Securities Act of 1933. ‘33 Act ETFs are more accepted than those under ‘40 funds.
Data show that American investors have welcomed the XRPC ETF, with trading volume soaring to $26 million within the first 30 minutes. This means that the fund will likely flip the Bitwise Solana Trust (BSOL) ETF, which had over $57 million in volume on the first day.
READ MORE: Bitcoin Price Prediction: Reasons BTC May Crash Below $90k Soon
More XRP ETFs are coming, with eight more set to be listed on DTCC, which handles clearing, settlement, and custody for most ETFs. They include filings by companies such as Franklin Templeton, Bitwise, and Invesco. JPMorgan believes that these funds will have over $8 billion in inflows in the first year.
XRP price wavered after the ETF launch for two main reasons. First, the approval was in line with analysts’ expectations. Polymarket and Kalshi odds of an approval stood at over 98% before the launch. As such, while significant, the launch did not catch investors by surprise.
Second, Ripple wavered due to the broader crypto market’s performance, which has struggled over the past few months. The market capitalization of all coins stood at $3.4 trillion, with Bitcoin falling to $100,000.
XRP Price Technical Analysis
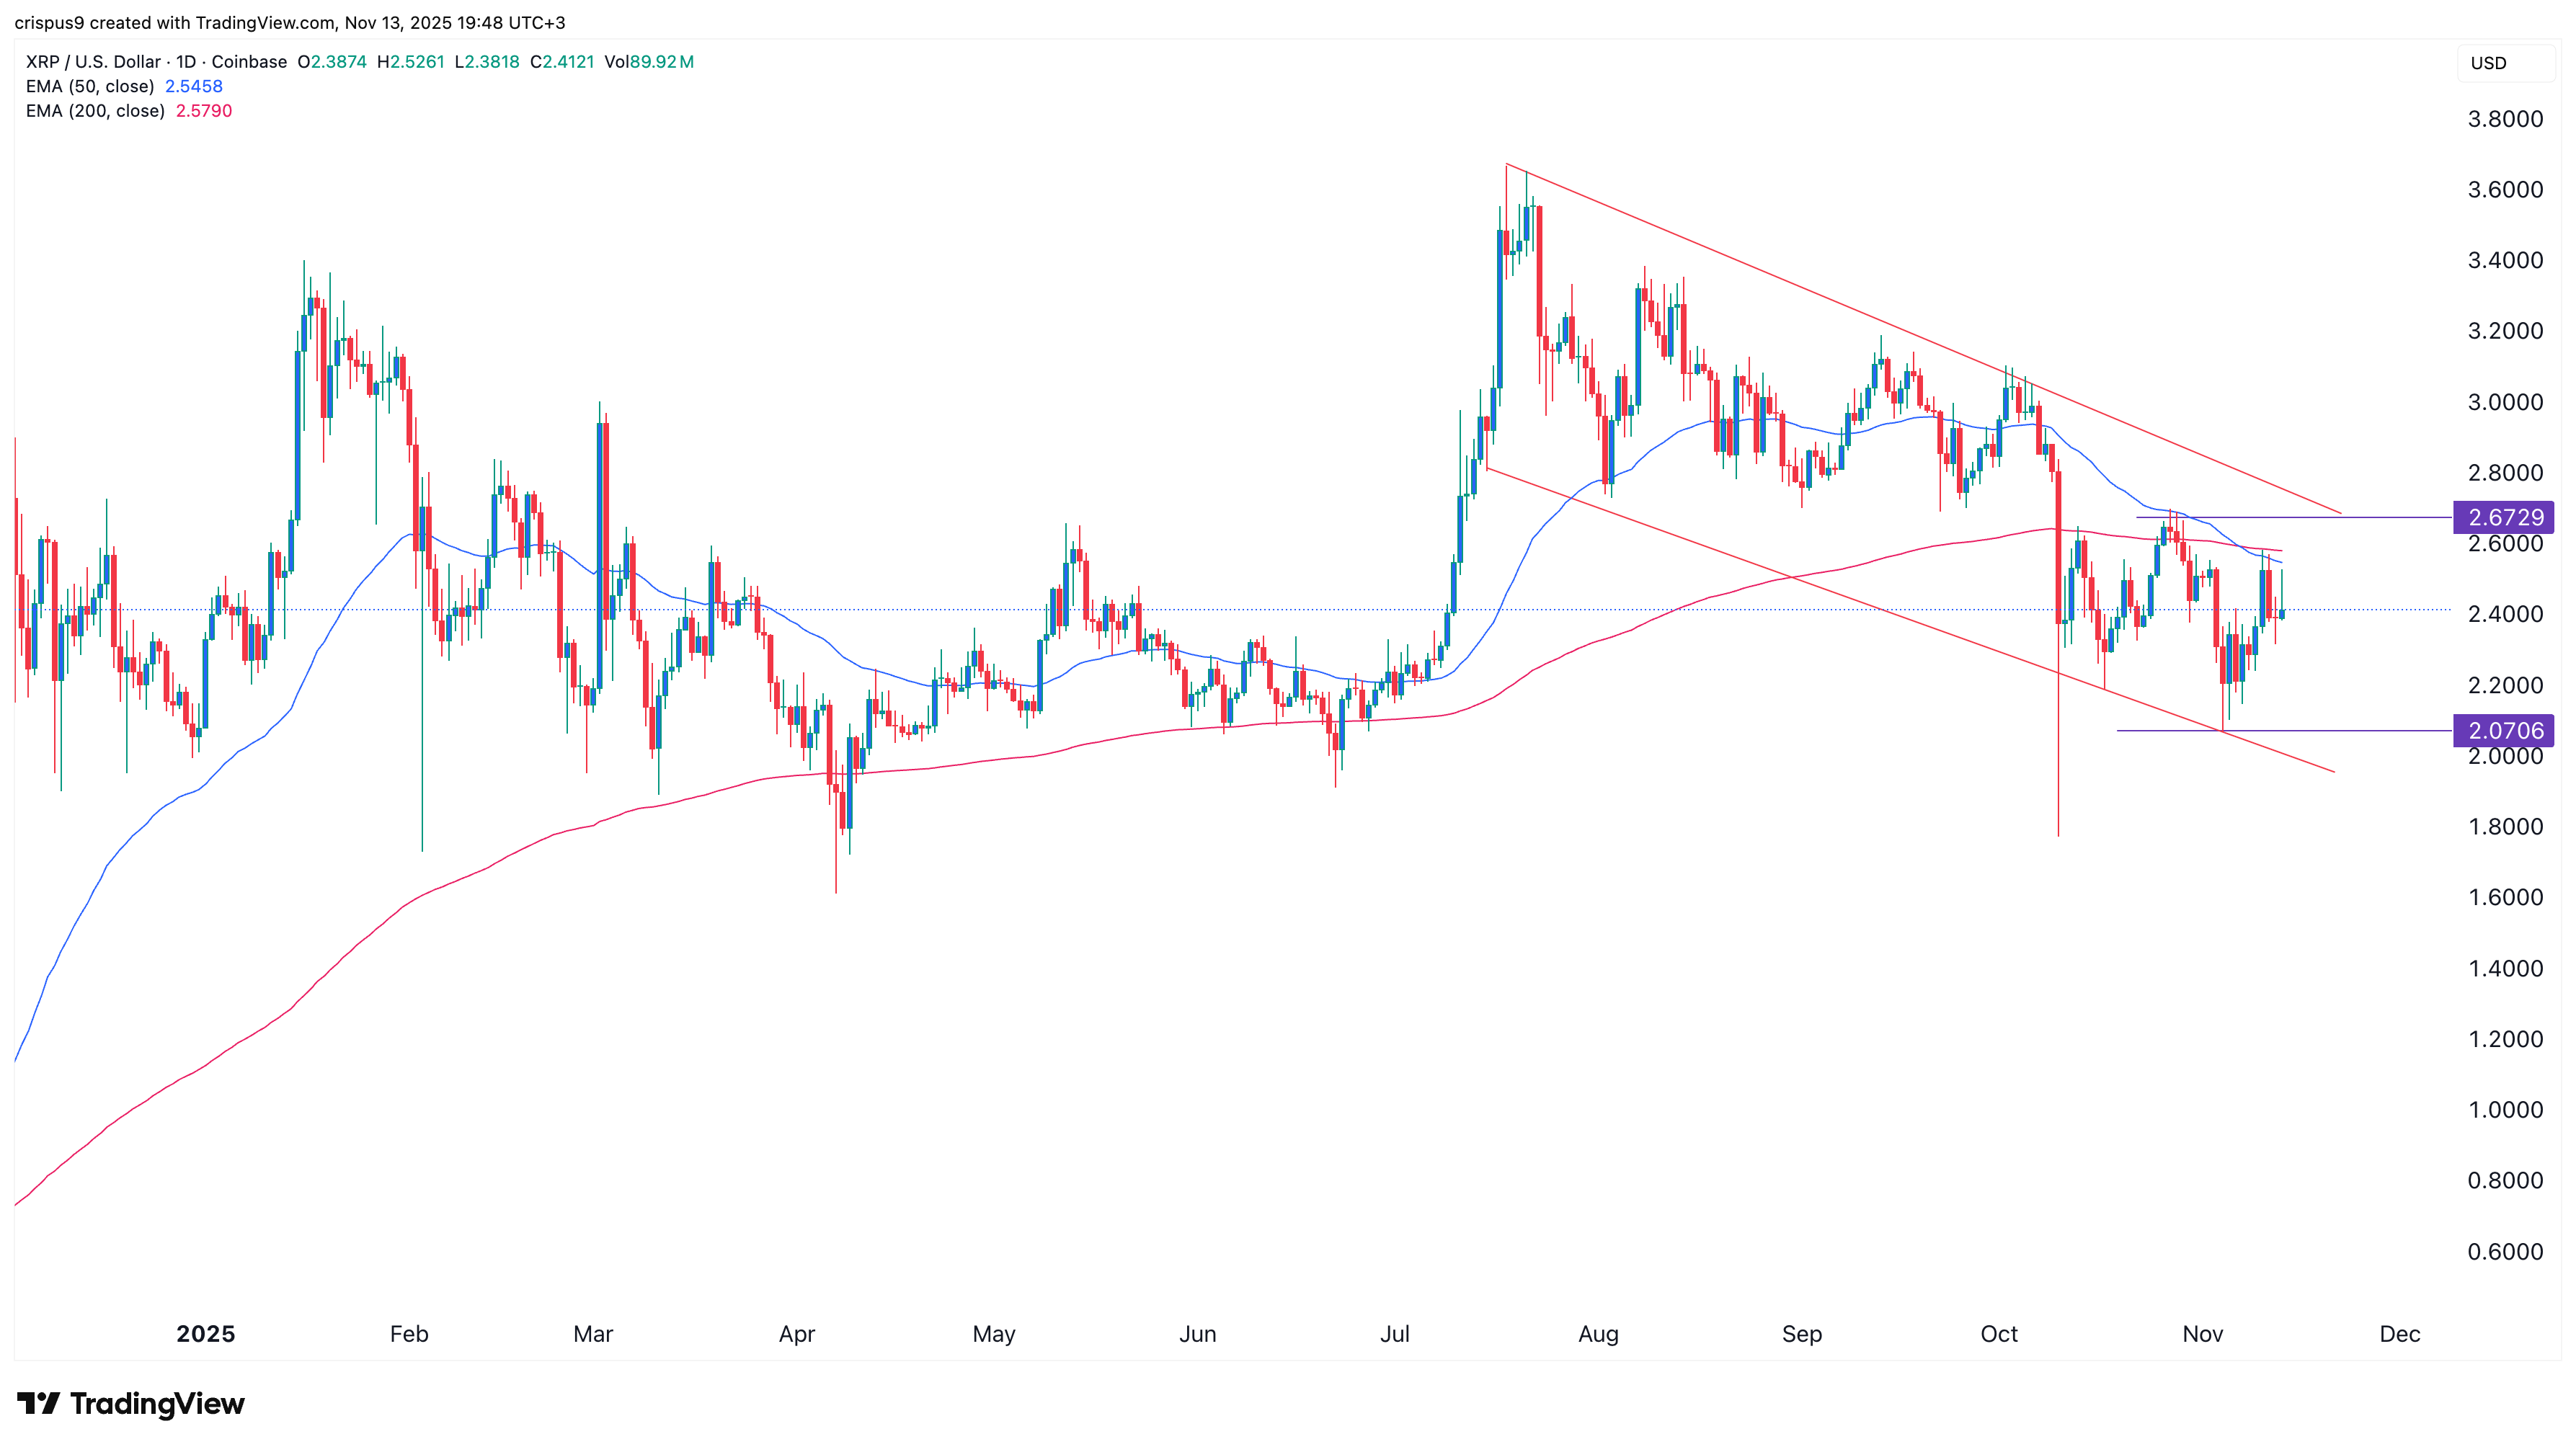
Technicals also contributed to the XRP price performance. The chart above shows that it has remained inside the descending channel shown in red. That is a sign of substantial selling pressure.
Additionally, the token has formed a death cross pattern, as the 50-day and 200-day Exponential Moving Averages (EMAs) crossed. A death cross is usually one of the riskiest patterns in technical analysis.
Therefore, the most likely Ripple price forecast is bearish, with the next key level at $2.00. A move above the upper side of the descending channel will point to more gains.
READ MORE: XPL Price Risks Crash to Record Low as Key Plasma Metrics Implode