


Zcash price has staged a strong rebound over the past three days, even as the crypto market crashed. The ZEC token rose to a high of $600, up about 40% from its lowest level this week. Still, there is a likelihood that the token will resume its downtrend, as it is slowly forming a bearish double top.
Zcash Price Technical Analysis Points to a Dive
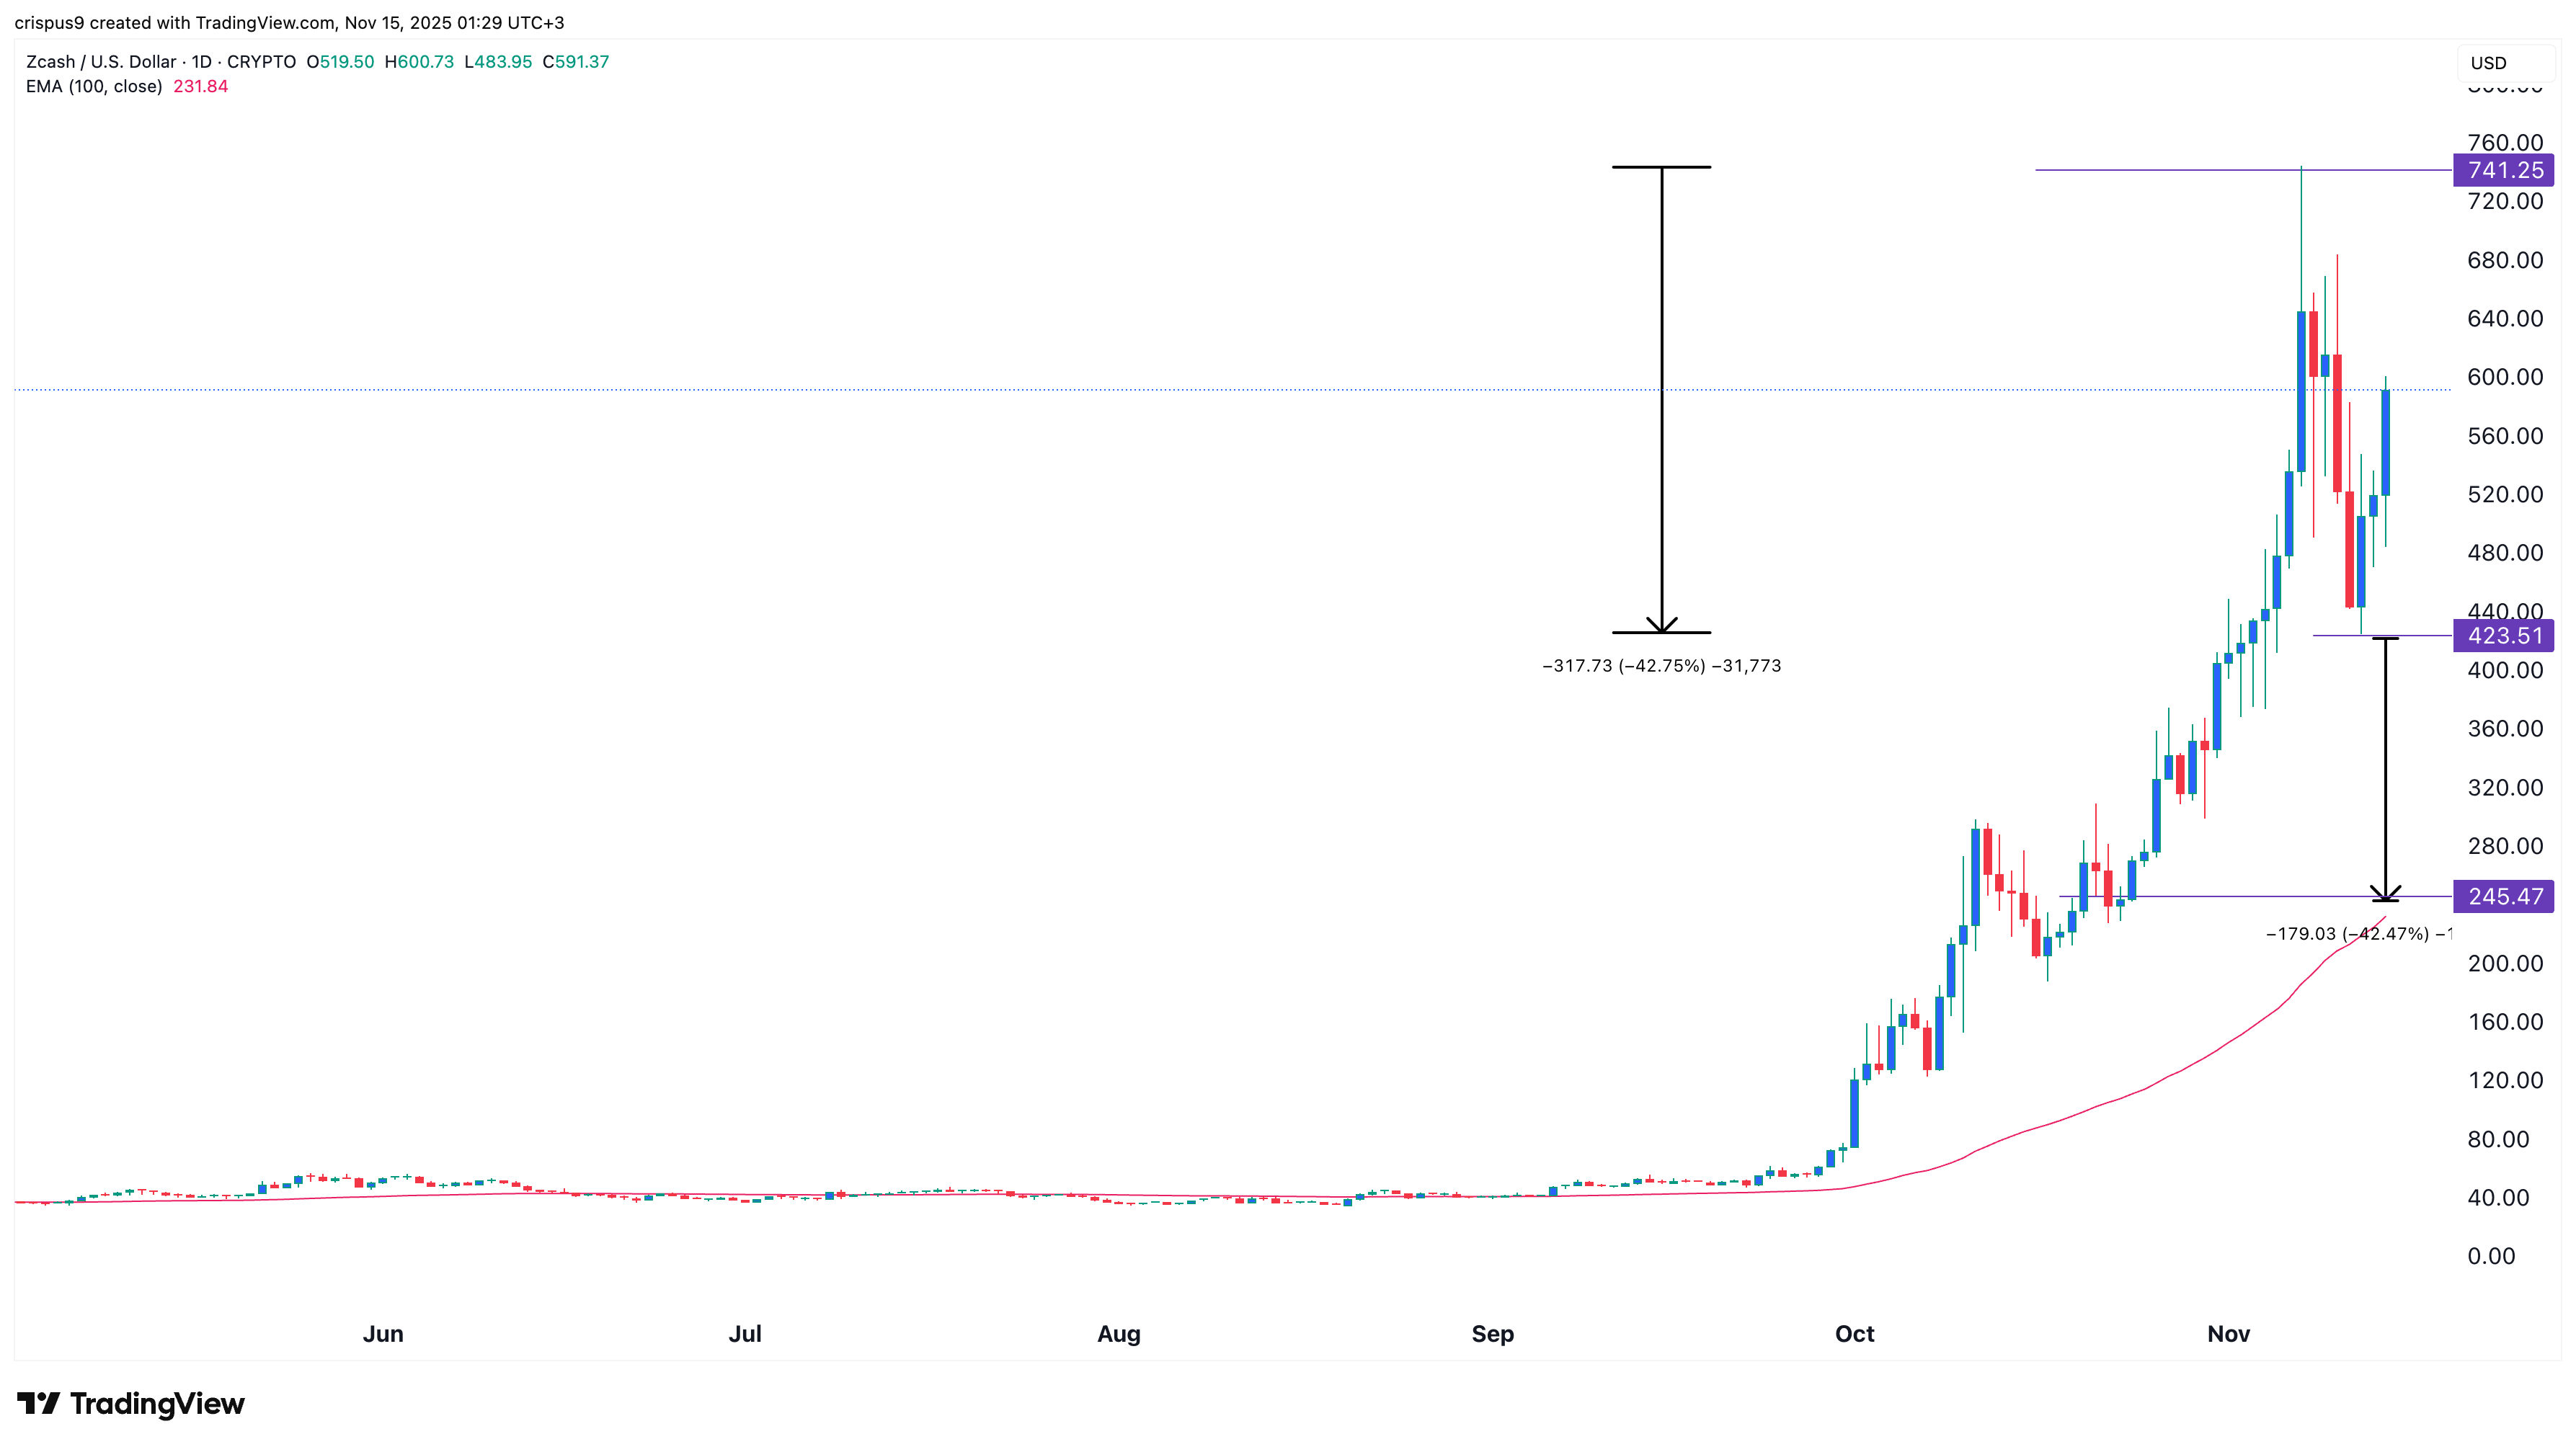
The daily timeframe chart shows that the Zcash price has been in a strong uptrend in the past few months. ZEC has jumped from a low of $34.95 in August to a high of ~$745, a ~2,090% surge.
The token jumped as it emerged from the accumulation phase of the Wyckoff Theory. Its recent surge was part of its markup phase, characterized by higher demand than supply.
Recently, however, there have been signs that it has entered the distribution phase of Wyckoff Theory. This phase typically features large swings as bulls buy each dip.
Most notably, there are signs that the Zcash price is forming a double-top pattern, with the upper side at $745 and the neckline at $423.
READ MORE: Will Crypto Recover as Fear and Greed Index Nears Buy Zone?
If this pattern holds, the token will jump by about 28% and then resume its downtrend. This is where it transitions from the current distribution to the markdown, where panic selling occurs.
The price target in a double-top pattern is established by measuring the distance from the top to the neckline, which is about 42%. Measuring the same distance from the neckline yields a Zcash price target of $245.
On the other hand, a move above the double-top point suggests there are still buyers in the market. This will, in turn, push the token up, potentially to $1,000 as Arthur Hayes predicts.
Why ZEC Price May Drop Soon
There are three other reasons why the ZEC price may crash soon. First, the token may plunge due to mean reversion, a phenomenon in which an asset drops back toward its historical averages.
In this case, the current price of $583 is much higher than the 100-day Exponential Moving Average (EMA) at $230. As such, there is a likelihood it will retreat as bears attempt to move it back toward its historical averages.
Second, the coin will likely pull back as investors start to book profits after the recent surge. It is common for assets that go parabolic to pull back as investors start to take profits. This retreat normally happens as the hype starts to fade.
Additionally, the futures open interest has been in a strong uptrend in the past few months. It moved from a low of $22.5 million in September to the current $865 million. It is common for highly leveraged tokens to pull back as bulls are liquidated.