


The MSTR stock price continued its freefall today, November 20, reaching a low of $174, its lowest level since October 7. Strategy shares have now plunged by over 60% from their highest level this year, with their mNAV metric falling to 0.890.
The ongoing Strategy crash has cost investors billions of dollars as its market capitalization has dropped from the all-time high of $130 billion in July to $49 billion today. The value of its Bitcoin holdings has moved from over $80 billion to $57 billion today.
MSTR is plunging because of the ongoing crypto market crash. The Bitcoin price dropped from its all-time high of $126,300 to $86,442. If the trend continues, the company’s Bitcoin purchases could go underwater, as its average purchase cost for its accumulation is $74,430.
READ MORE: DJT Stock in a Freefall as Trump Media Faces a Double Whammy
Bitcoin continued its downtrend as fear spread across the stock and crypto markets. The Crypto Fear and Greed Index has moved to the extreme fear zone of 15, while the CNN index plunged to 8. Historically, stocks and cryptocurrencies have crashed when investors feel fear.
Bitcoin also dived as some large investors continued selling. Owen Gunden, one of the top Bitcoin OGs, has sold all his coins, which he has held since 2011. His final sale happened on Thursday when he transferred $230 million worth of coins to Kraken.
Another Bitcoin OG moved 850 coins, worth about $78 million, on Thursday by sending them to Paxos. Before that, he sold 2,300 coins worth $211 million two weeks ago.
MSTR Stock Price Technical Analysis
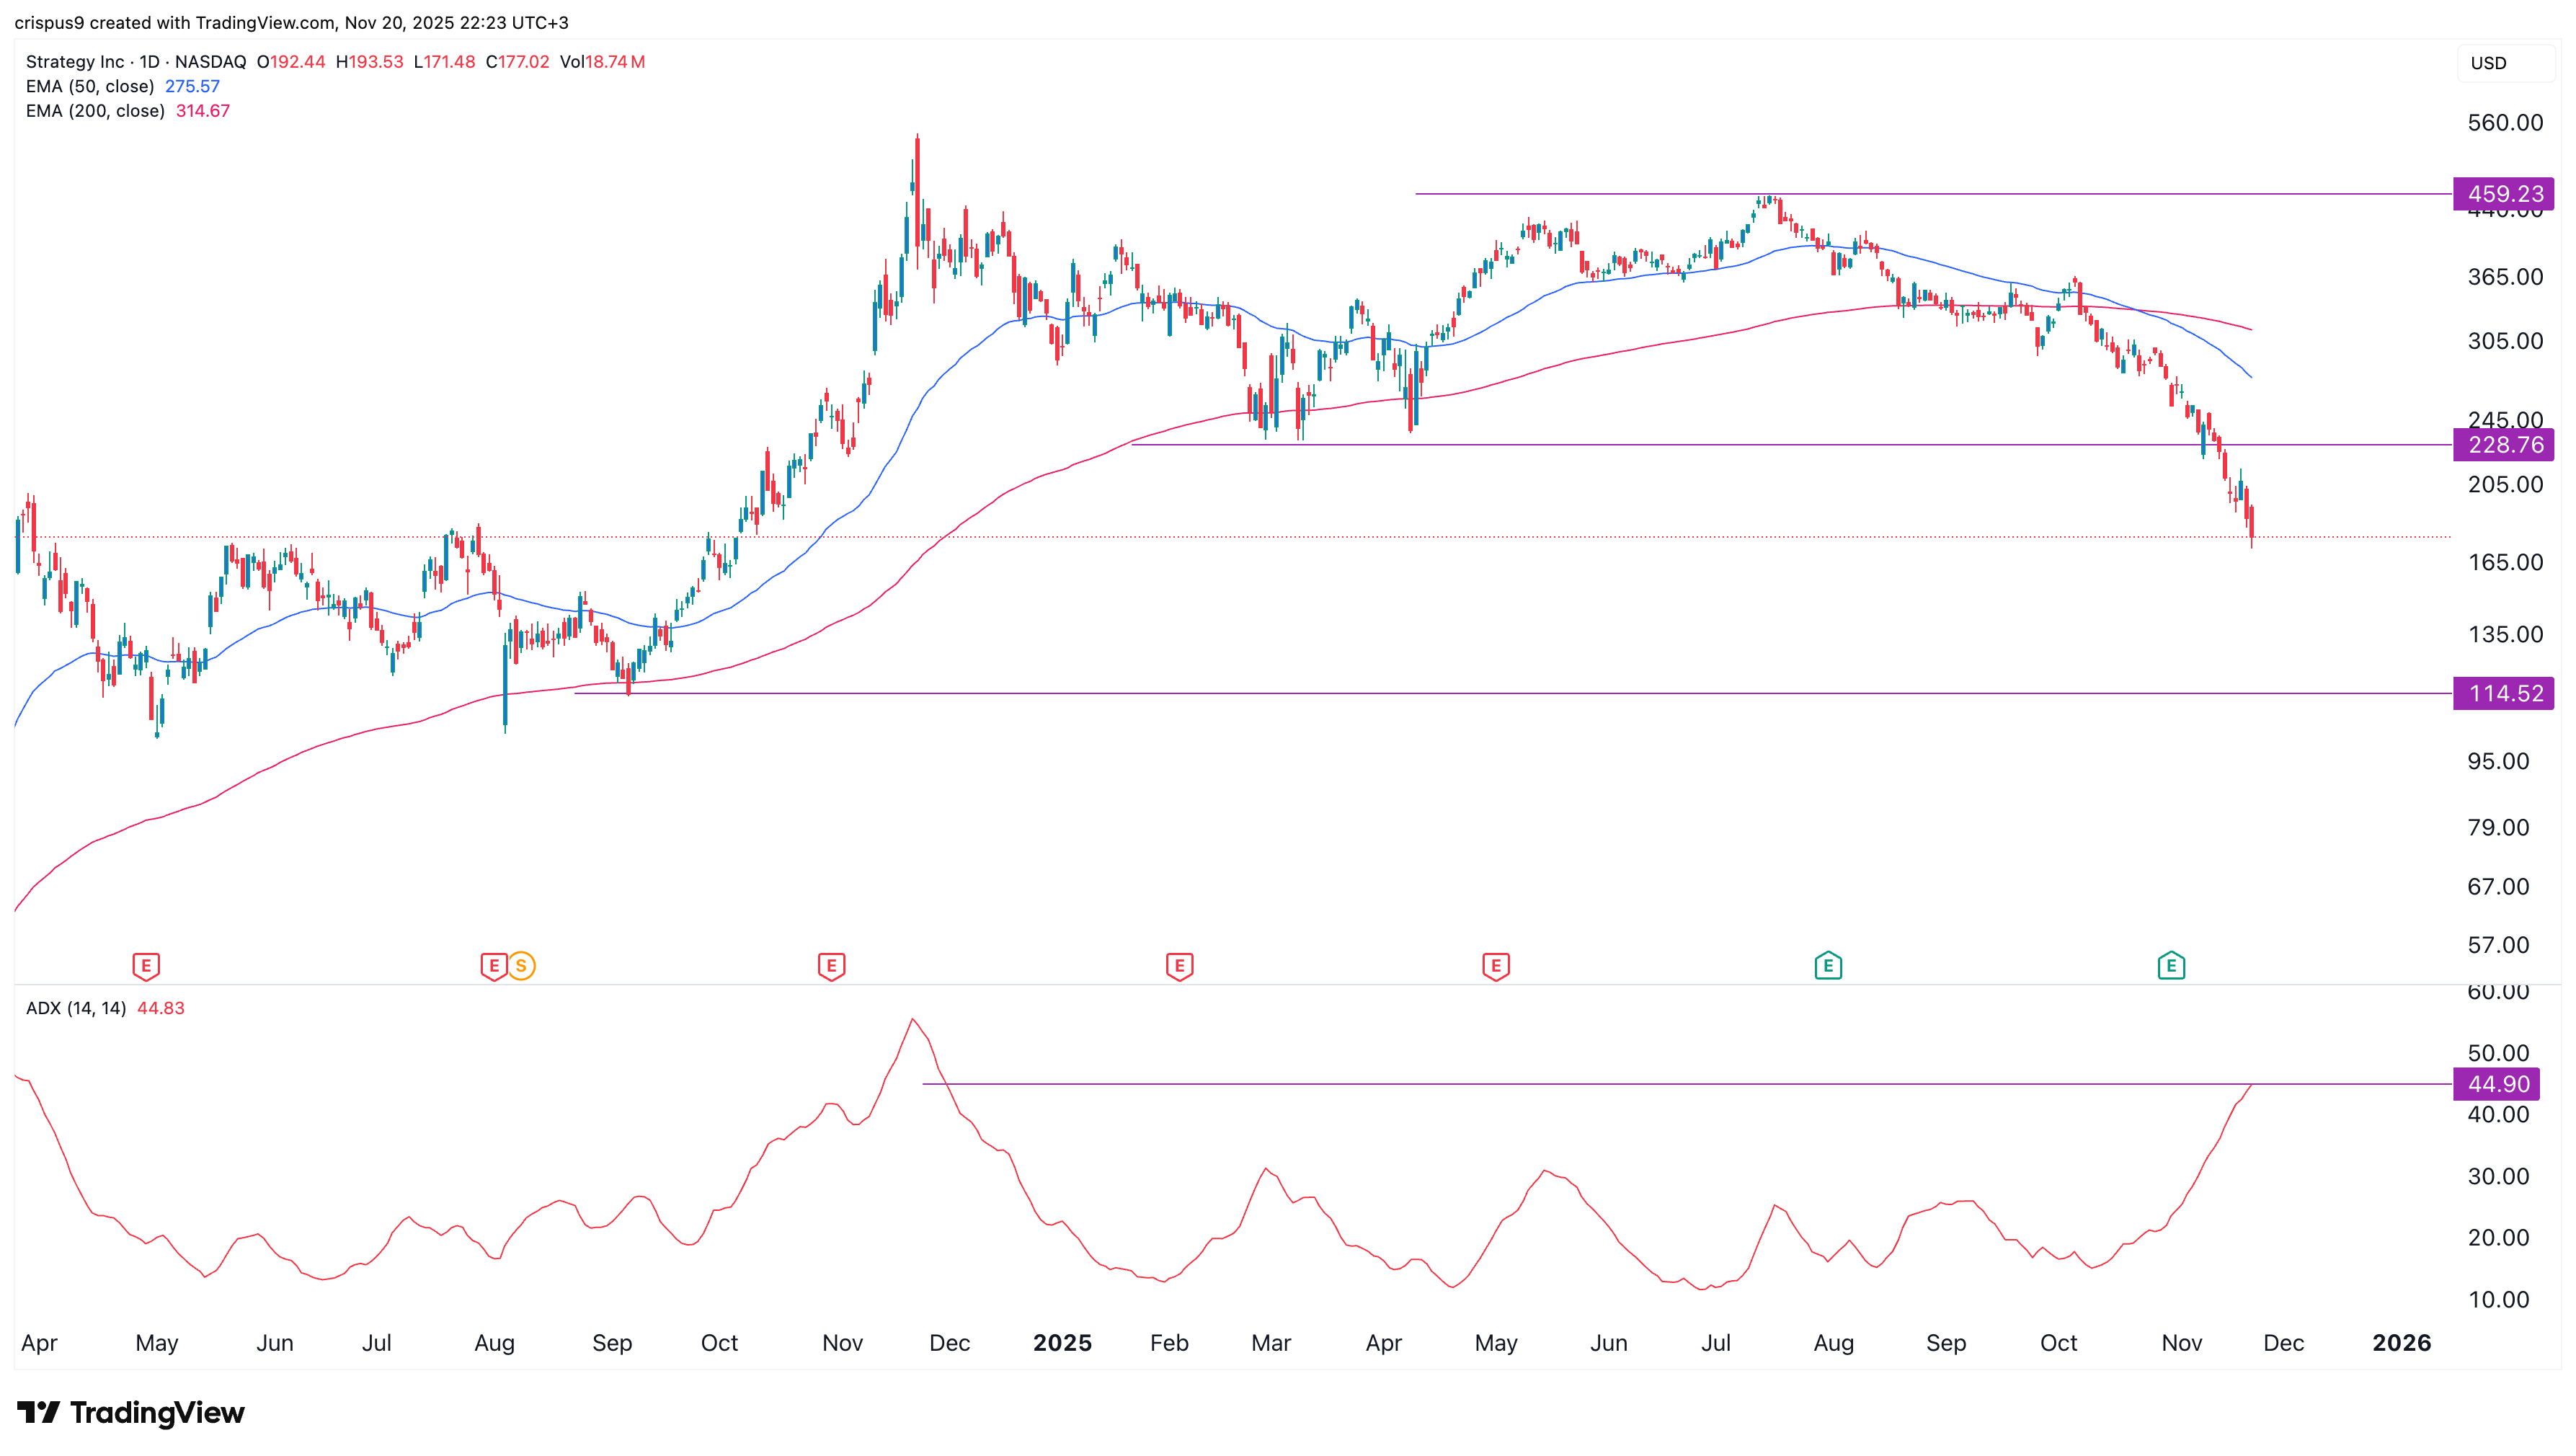
The daily timeframe chart shows that the Strategy stock price has been in a strong downward trend in the past few months, moving from a high $460 in July to the current $172.
It has now plunged below the important support level at $228, its lowest level in March and April this year. The stock has formed a death cross, which occurs when the 50-day and 200-day Exponential Moving Averages (EMAs) cross.
The Average Directional Index (ADX) jumped to 44.90, its highest level since November last year. Also, the Relative Strength Index (RSI) and the MACD indicators have continued to fall over the past few weeks.
Therefore, the stock will likely continue falling as sellers target the next key support level at $150. A move below the support at $150 will signal further downside, potentially to $114, its lowest level in September last year.
READ MORE: Ethereum Price Could Rebound Despite Machi Big Brother Liquidations