


HBAR price bottomed at a crucial support level during the ongoing crypto market crash. Hedera was trading at $0.1400, a few points above last week’s low of $0.1266. It remains 53% below the year-to-date high and 65% lower than the 2024 high.
HBAR Price to Benefit From ETF Inflows
One of the top catalysts for Hedera price is the ETF’s recent launch, which is attracting moderate demand from American investors.
Data compiled by SoSoValue shows that the Canary HBAR ETF has had over $72 million in inflows since its launch on October 28. The fund had only one day of outflows, which is notable as spot Bitcoin and Ethereum ETFs have had substantial outflows in the same period.
READ MORE: Why is Pi Network Price Suddenly Beating Bitcoin and Ethereum?
The ETF now holds about $54 million in assets, which is equivalent to about 1% of its market capitalization. Chances are the coin will continue to see higher inflows over the next few months, especially as the crypto market recovers.
The HBAR price has also stabilized amid hopes that Hedera meets the criteria for the new ISO 20022 standard. According to Swift, all bank-to-bank payment messages will now run on the new standard. Some analysts believe that Hedera meets this criterion as it is already used by so many large banks and other institutions.
Still, there are some major concerns about Hedera. One of them is that its ecosystem is relatively small for a coin valued at over $7 billion. It has a total value locked (TVL) of less than $200 million, meaning that many people are no longer using it.
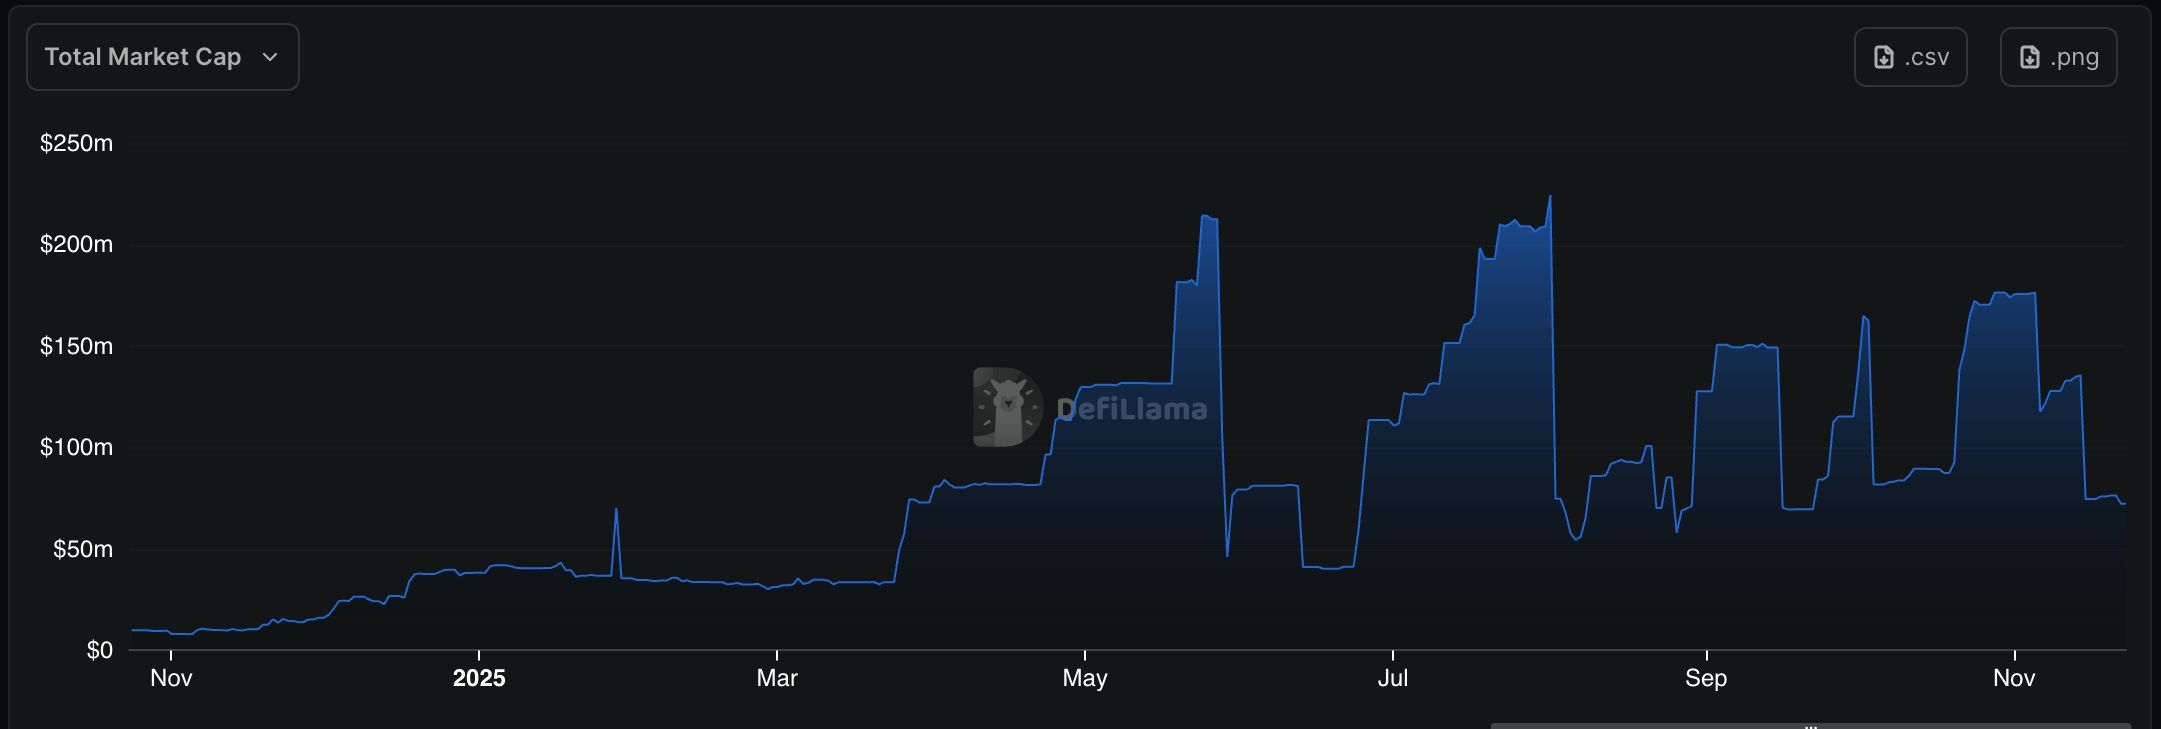
Another major concern is that the stablecoin network continues to have pumps and dumps, as shown below. The stablecoin supply now stands at $72 million, down from this month’s high of $172 million. The supply often jumps and then plunges, which is a red flag.
Hedera Price Technical Analysis
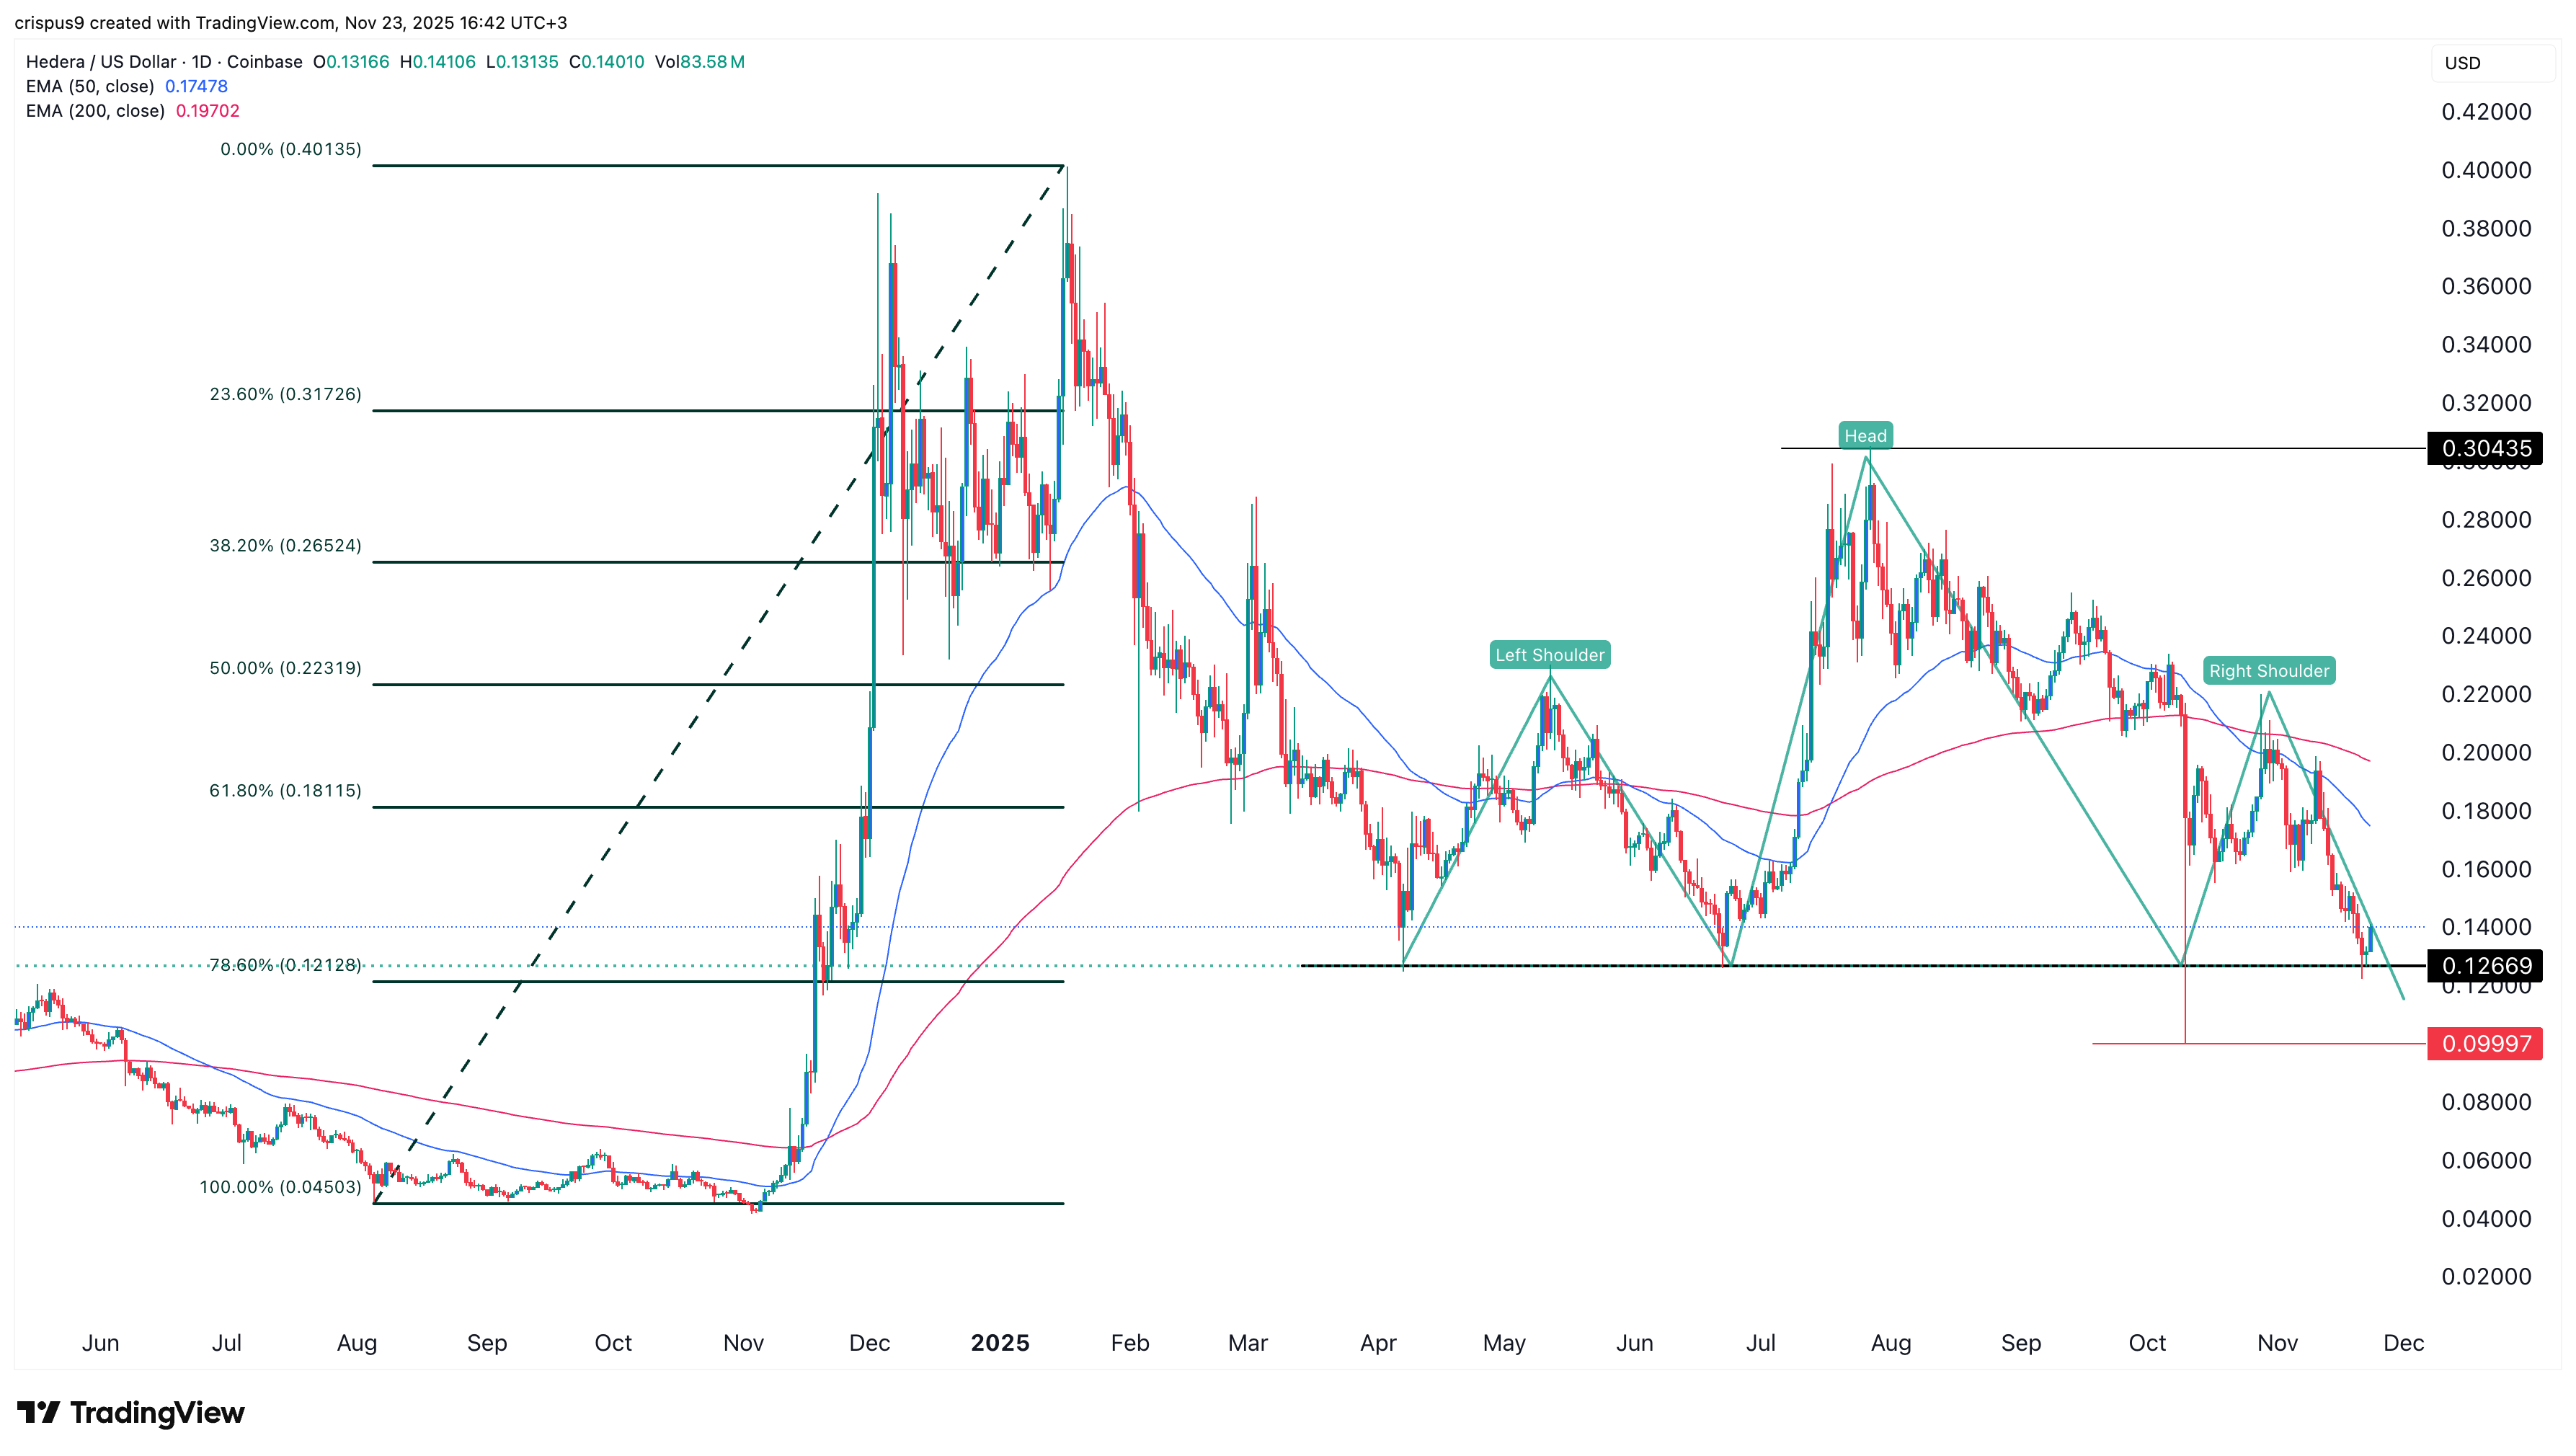
The daily timeframe chart shows that the HBAR price has been under pressure in the past few months, mirroring the performance of other cryptocurrencies.
It dropped from a high of $0.3043 in July to a low of $0.1266 on Saturday. Its lowest level was notable as it was the lowest swing in April and June this year.
Hedera has failed to move below that level several times this year, making it an important support level.
It has also formed a death cross pattern, as the 50-day and 200-day Exponential Moving Averages (EMAs) crossed.
Worse, the token has formed a head-and-shoulders pattern, a common bearish signal. The current level is the neckline point of this pattern. HBAR price also formed a death cross pattern on October 20th.
Therefore, the most likely HBAR price forecast is bearish, with the next key support level at $0.10, its lowest level on October 10, when the surge in liquidations occurred.
READ MORE: XRP Price Reaches Pivotal Support as ETFs Near a $500M Milestone