


XRP’s price crashed by over 14% in November, despite major positive updates. It ended the month trading at $2.20, down ~40% from its year-to-date high. This Ripple price prediction explores what to expect in December.
XRP Price Dropped Despite ETF Approval and RLUSD Growth
The XRP token remained on edge in November despite having some notable news. First, the developers held the Ripple Swell event earlier during the month. This was an important event that brought together some of the world’s largest companies.
The biggest outcome of the event was that Ripple Labs received a $500 million investment from Citadel and Fortress, valuing it at $40 billion. Ripple’s management insisted that the company was not planning to go public as it had enough resources to fund its growth.
The other notable XRP news in December was the approval of several crypto ETFs, which have been received well by market participants. These funds have attracted over $600 million in inflows in less than three weeks, a trend that may accelerate in December.
XRP also benefited from the growth of Ripple USD (RLUSD), which crossed the important $1 billion asset milestone during the month. This surge has made it one of the biggest stablecoins in the crypto industry.
Therefore, the XRP price crashed in November due to the broader crypto market crash that affected Bitcoin and other altcoins. Bitcoin dropped to $80,000, while Ethereum and Solana had double-digit retreats.
Looking ahead, the Ripple price will likely react to the upcoming Federal Reserve interest rate cut and the general performance of the crypto market. Also, it will react to the potential Santa Claus rally, a situation where most assets rally ahead of Christmas.
Ripple Price Technical Analysis
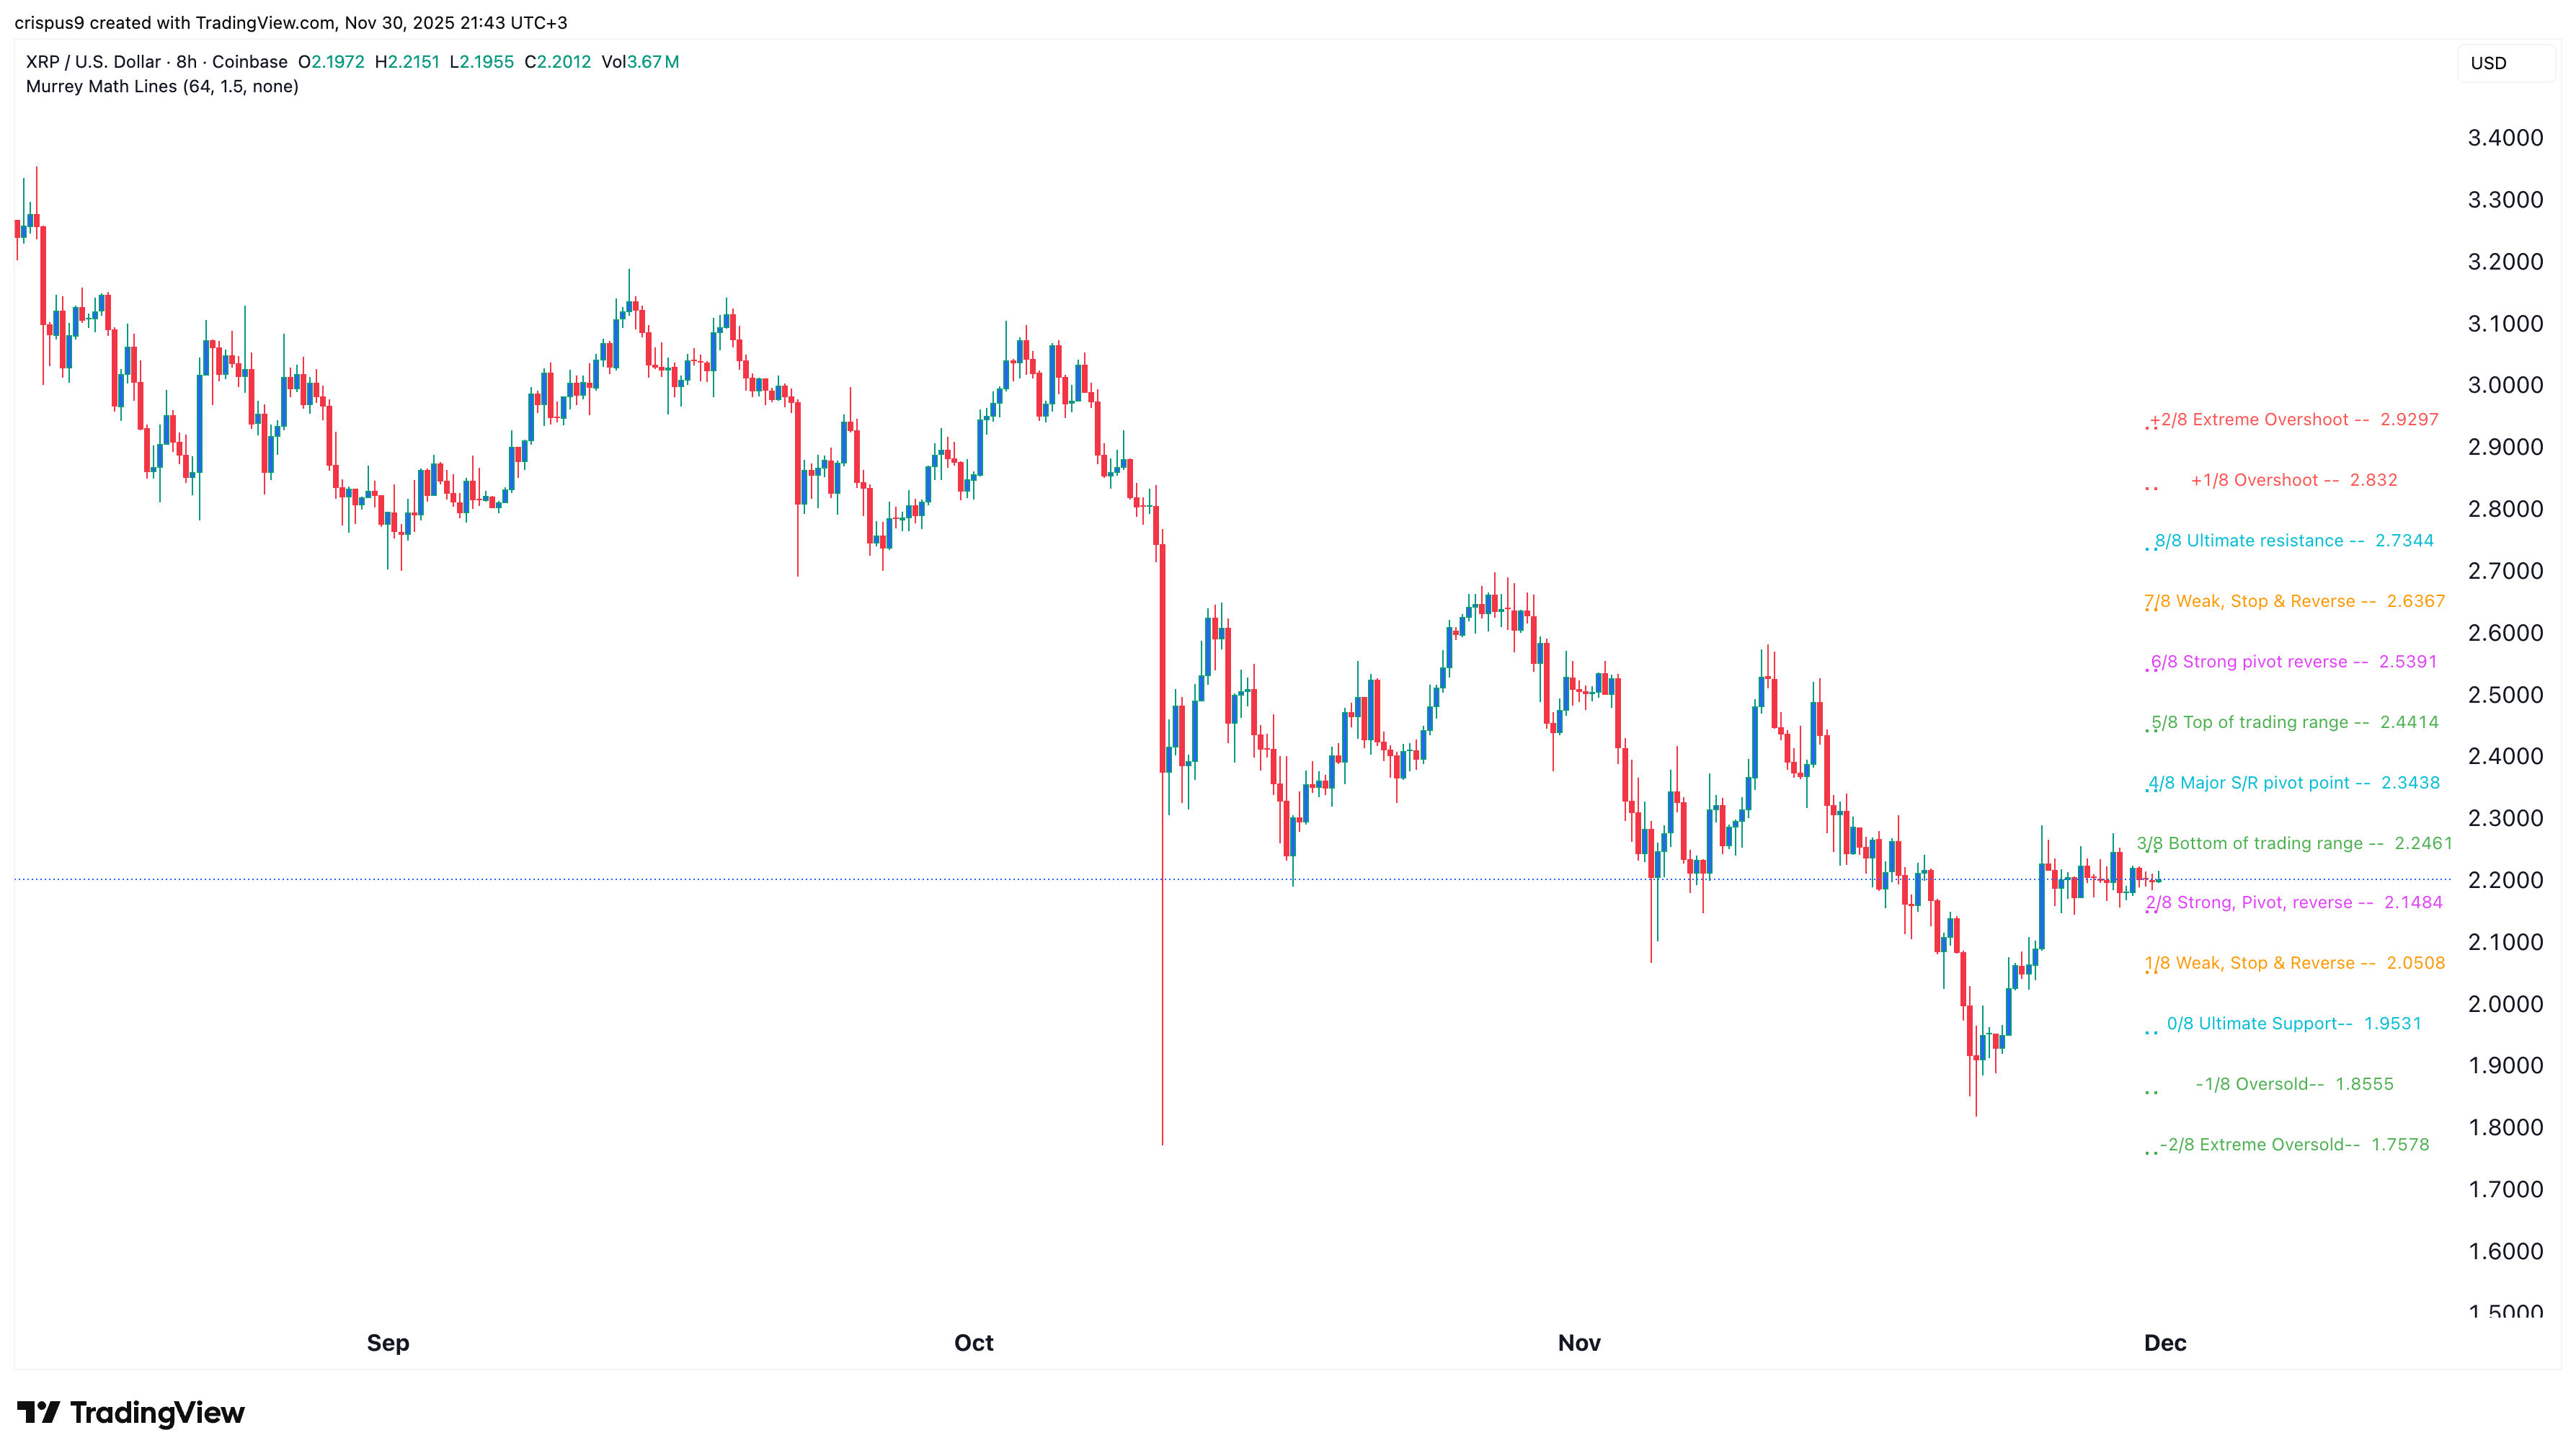
The eight-hour chart shows that the XRP price has remained under pressure in the past few months as the rally stalled. It has been stuck at $2.2, a notable level as it lies along the strong pivot and reversal level of the Murrey Math Lines tool.
The Ripple token has formed a bullish flag pattern, which consists of a vertical line and a horizontal channel. This pattern often leads to a strong bullish breakout, which may happen this month.
A rebound may push the token to the ultimate resistance level of the Murrey Math Lines tool at $2.7345, which is about 25% above the current level.
On the other hand, a drop below the key support level at $1.9530, the ultimate support of the Murrey Math Lines tool, will invalidate the bullish outlook.
READ MORE: Yearn Finance yETH Pool Suffers $9M Loss in Latest DeFi Exploit