


The MSTR stock price has stabilized this week as fears that MicroStrategy would start selling its Bitcoin holdings to pay its debt and dividends faded, and BTC rebounded. Strategy was trading at $188 on Tuesday, up from last month’s low of $156. Still, technicals suggest that the shares could be at risk of a deeper dive.
Fears of Strategy Selling Bitcoin Fades
The MSTR stock price came under intense pressure after the CEO warned that the company may be forced to sell its Bitcoin holdings to cover key payments, including debt and dividends to preferred investors.
In a separate statement as panic spread, the company noted that it had over $1.2 billion in cash reserves, which it planned to use to settle its dues in the foreseeable future.
READ MORE: LUNA, USTC, LUNC Prices Soar Ahead of Do Kwon Sentencing: Brace for a Crash
And in a sign of confidence, the company made its largest Bitcoin purchase since July. It spent over $900 million acquiring Bitcoin last week, a move that brought its total hoard to 660,624. Its hoard is now valued at over $61 billion, well above its market capitalization of $54 billion.
These numbers mean that the market-cap-based NAV multiple stands at 0.889, while the enterprise-value-based figure has fallen to 1.132. A falling NAV multiple is risky for the company as it makes it less attractive to investors. It also makes it difficult for the company to raise money cheaply.
Indeed, the company’s recent Bitcoin purchase was funded by the sale of ordinary and preferred stock worth almost $1 billion last week, a move that has aggressively diluted investors.
The MSTR stock has also stabilized as the Bitcoin price has rebounded from the recent low of $80,000 to nearly $95,000 on Tuesday as market participants waited for the upcoming Federal Reserve interest rate decision. A rebound in Bitcoin benefits Strategy because it is its primary business.
MSTR Stock Price Technical Analysis Points to More Downside
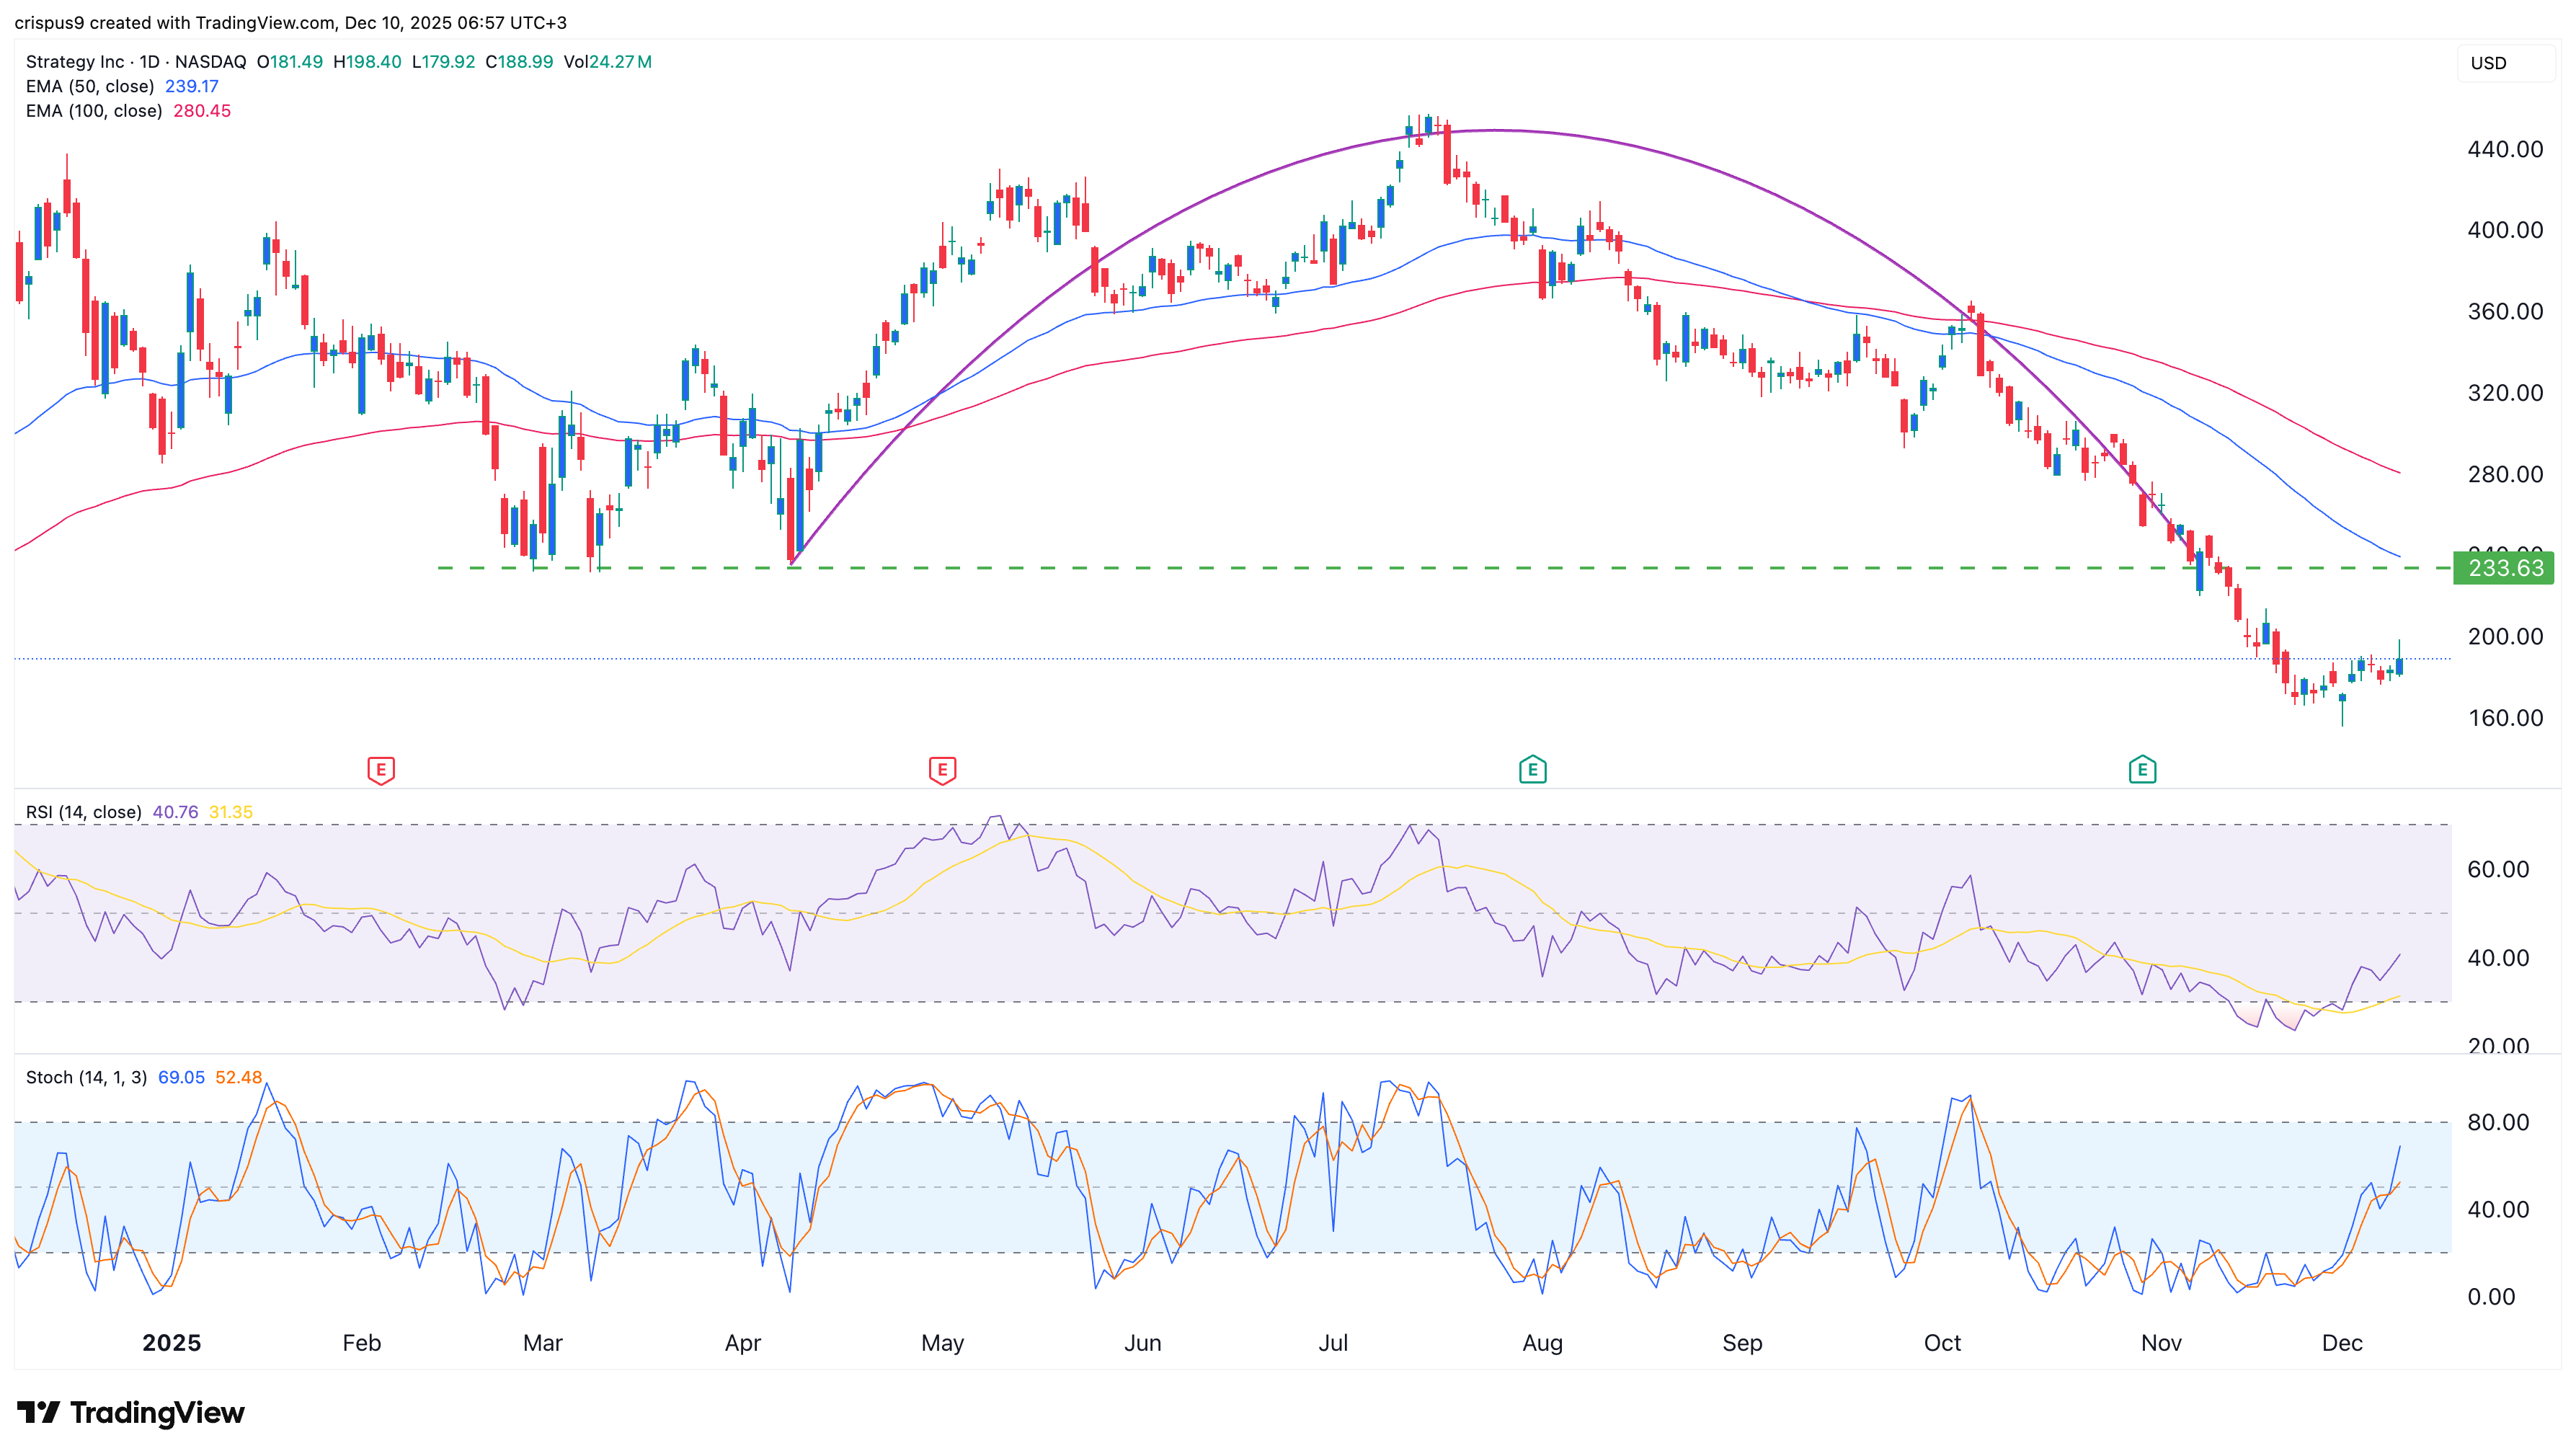
The daily timeframe chart shows that the MSTR share price has been moving sideways over the past few days. Along the way, it has slowly formed a bearish flag pattern, consisting of a vertical line and a horizontal channel, which is now in progress. This pattern often leads to a bearish breakout over time.
The other main risk is that the Strategy stock remains below the 50-day and 200-day Exponential Moving Averages (EMAs). That is a sign that bears are in control for now.
The stock has also remained below the key level at $233, the lower side of the inverted cup-and-handle pattern, a common bearish continuation sign in technical analysis.
On the positive side, the Relative Strength Index and the Stochastic Oscillator have been pointing upward, a sign that bullish momentum is building.
Therefore, the most likely scenario is that it continues rising as it attempts to form a break-and-retest pattern by moving back to the $233 resistance level. A break-and-retest is a common bearish continuation sign in technical analysis.
A complete reversal will be confirmed when the MSTR stock price rebounds and crosses the $233 resistance level.
READ MORE: Canton Network Price Jumps as RedStone Beats Chainlink for Oracle Role