


XRP price remains in a technical bear market after losing almost half of its value since its July peak. Ripple token was trading at $1.9010, down sharply from the all-time high of $3.6655. Its market capitalization has dropped from the all-time high of nearly $200 billion to $115 billion despite the soaring ETF inflows.
XRP Price Dumps Despite ETF Inflows Milestone
The XRP token has dropped sharply in the past few months, even as demand from American investors has jumped.
SoSoValue data shows that spot XRP ETFs brought in over $82 million in inflows last week, bringing that cumulative total to $1.07 billion. This growth brought the total net assets to $1.2 billion.
In contrast, spot Bitcoin ETFs shed over $497 million in assets, bringing their cumulative total to $57 billion. The outflows erased the $286 million inflows recorded in the previous week.
Meanwhile, Ethereum ETFs saw outflows over the last 7 days, bringing their cumulative net inflows to $12.4 billion. They shed over $643 million in assets last week after adding $208 million in the previous week.
XRP is also beating Solana, whose ETFs have had cumulative inflows of over $742 million and have $946 million in net assets. Other ETFs, such as Dogecoin, Chainlink, and HBAR, have seen muted investor demand.
READ MORE: Here’s Why the Crypto Market is Going Up Today: Is This a Santa Claus Rally?
Ripple price has underperformed the market despite ongoing demand from South Korean investors, who are showing substantial interest in the token.
CoinMarketCap data shows that most XRP trading occurs on Upbit, the country’s largest crypto exchange. Upbit’s volume jumped to $100 million in the last 24 hours, higher than other popular crypto exchanges like Binance and Coinbase.
XRP Price Technical Analysis
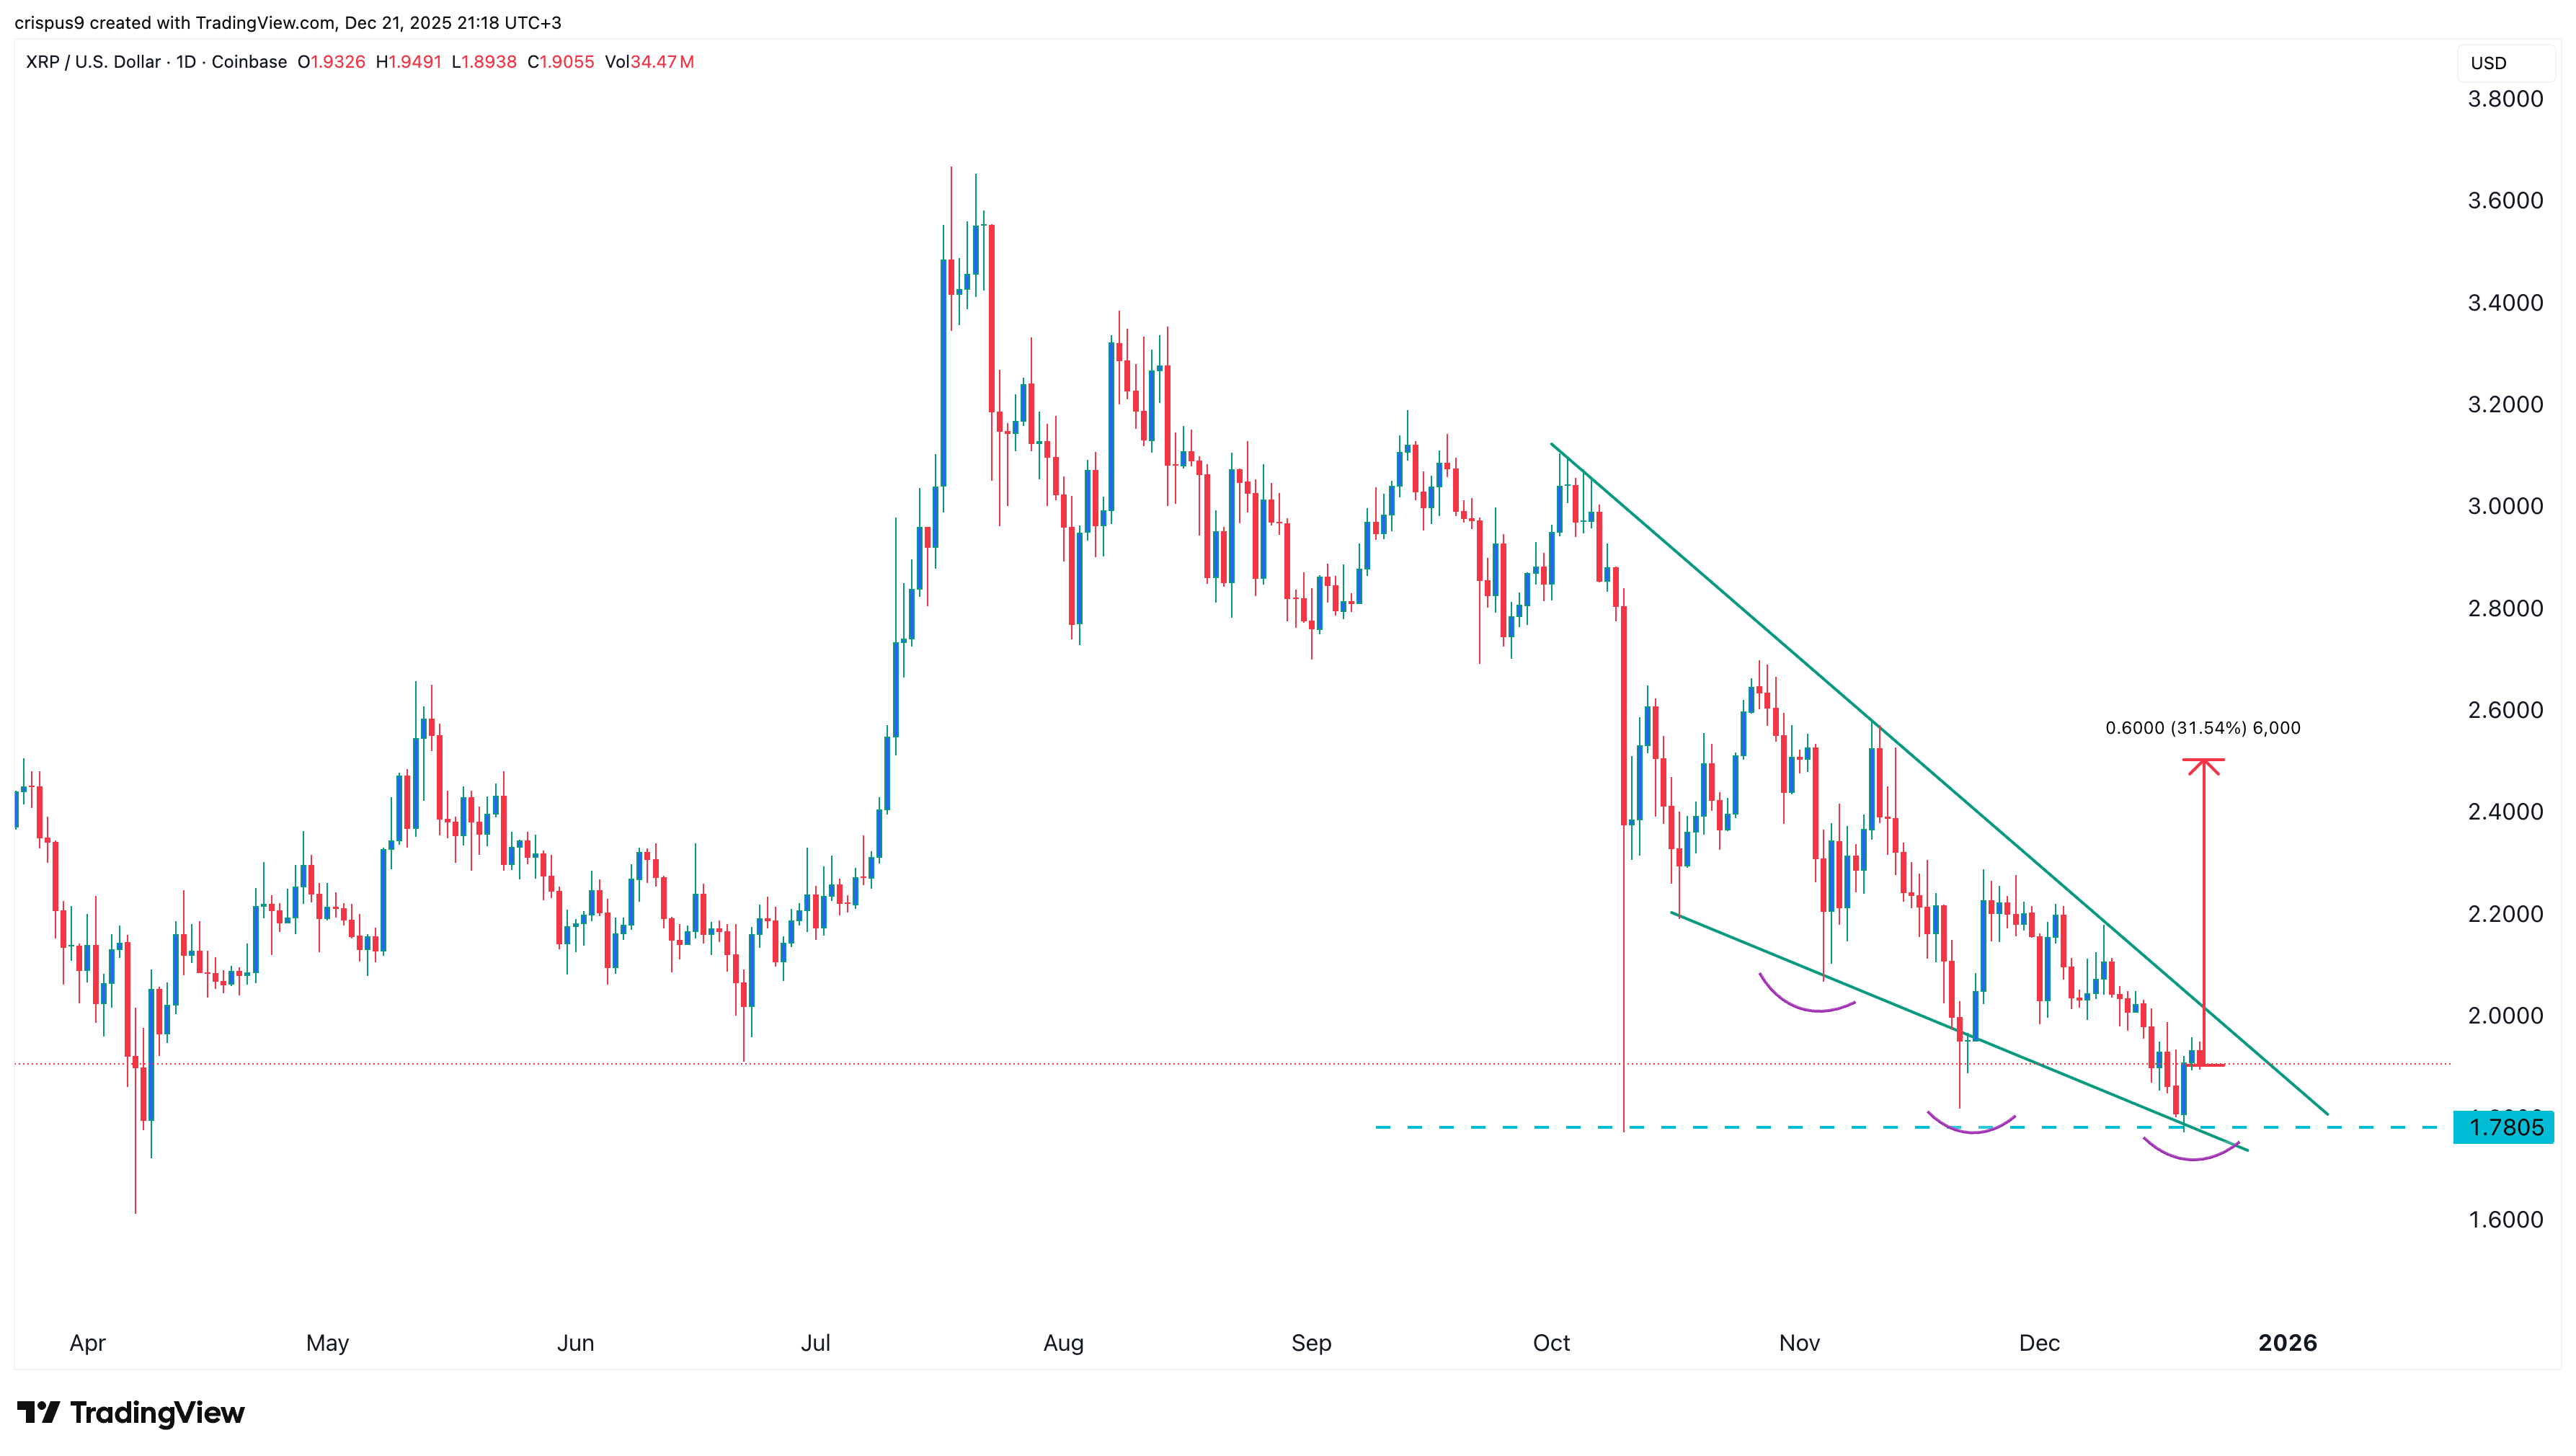
The daily timeframe chart shows the XRP price is bottoming after falling by ~40% from its highest level this year.
It has found necessary support at $1.7805, its lowest level in October, November, and December. That is a sign that it has formed a triple-bottom pattern, a common bullish reversal sign.
The token has also formed an inverse head-and-shoulders pattern and a falling wedge, two popular bullish reversal patterns.
Therefore, the most likely scenario is where it rebounds in the coming days, supported by its strong fundamentals, including the soaring ETF inflows. A rebound may push it to the critical resistance level at $2.50, which is 31% above the current level.
On the other hand, a drop below the triple-bottom point at $1.7805 will invalidate the bullish XRP price forecast and point to more downside, potentially to the key support at $1.500.
READ MORE: Silver Price Surged and Beat Gold, Crypto in 2025: Is a Crash Coming?