


XRP price reclaimed the important $2 resistance level as the crypto market rebound intensified on Friday. It jumped to $2.1375, its highest level since Dec. 9, and is ~20% above its lowest point in December. So, is the start of a Ripple breakout or a mere fakeout?
XRP Price Technicals are Sending Mixed Signals
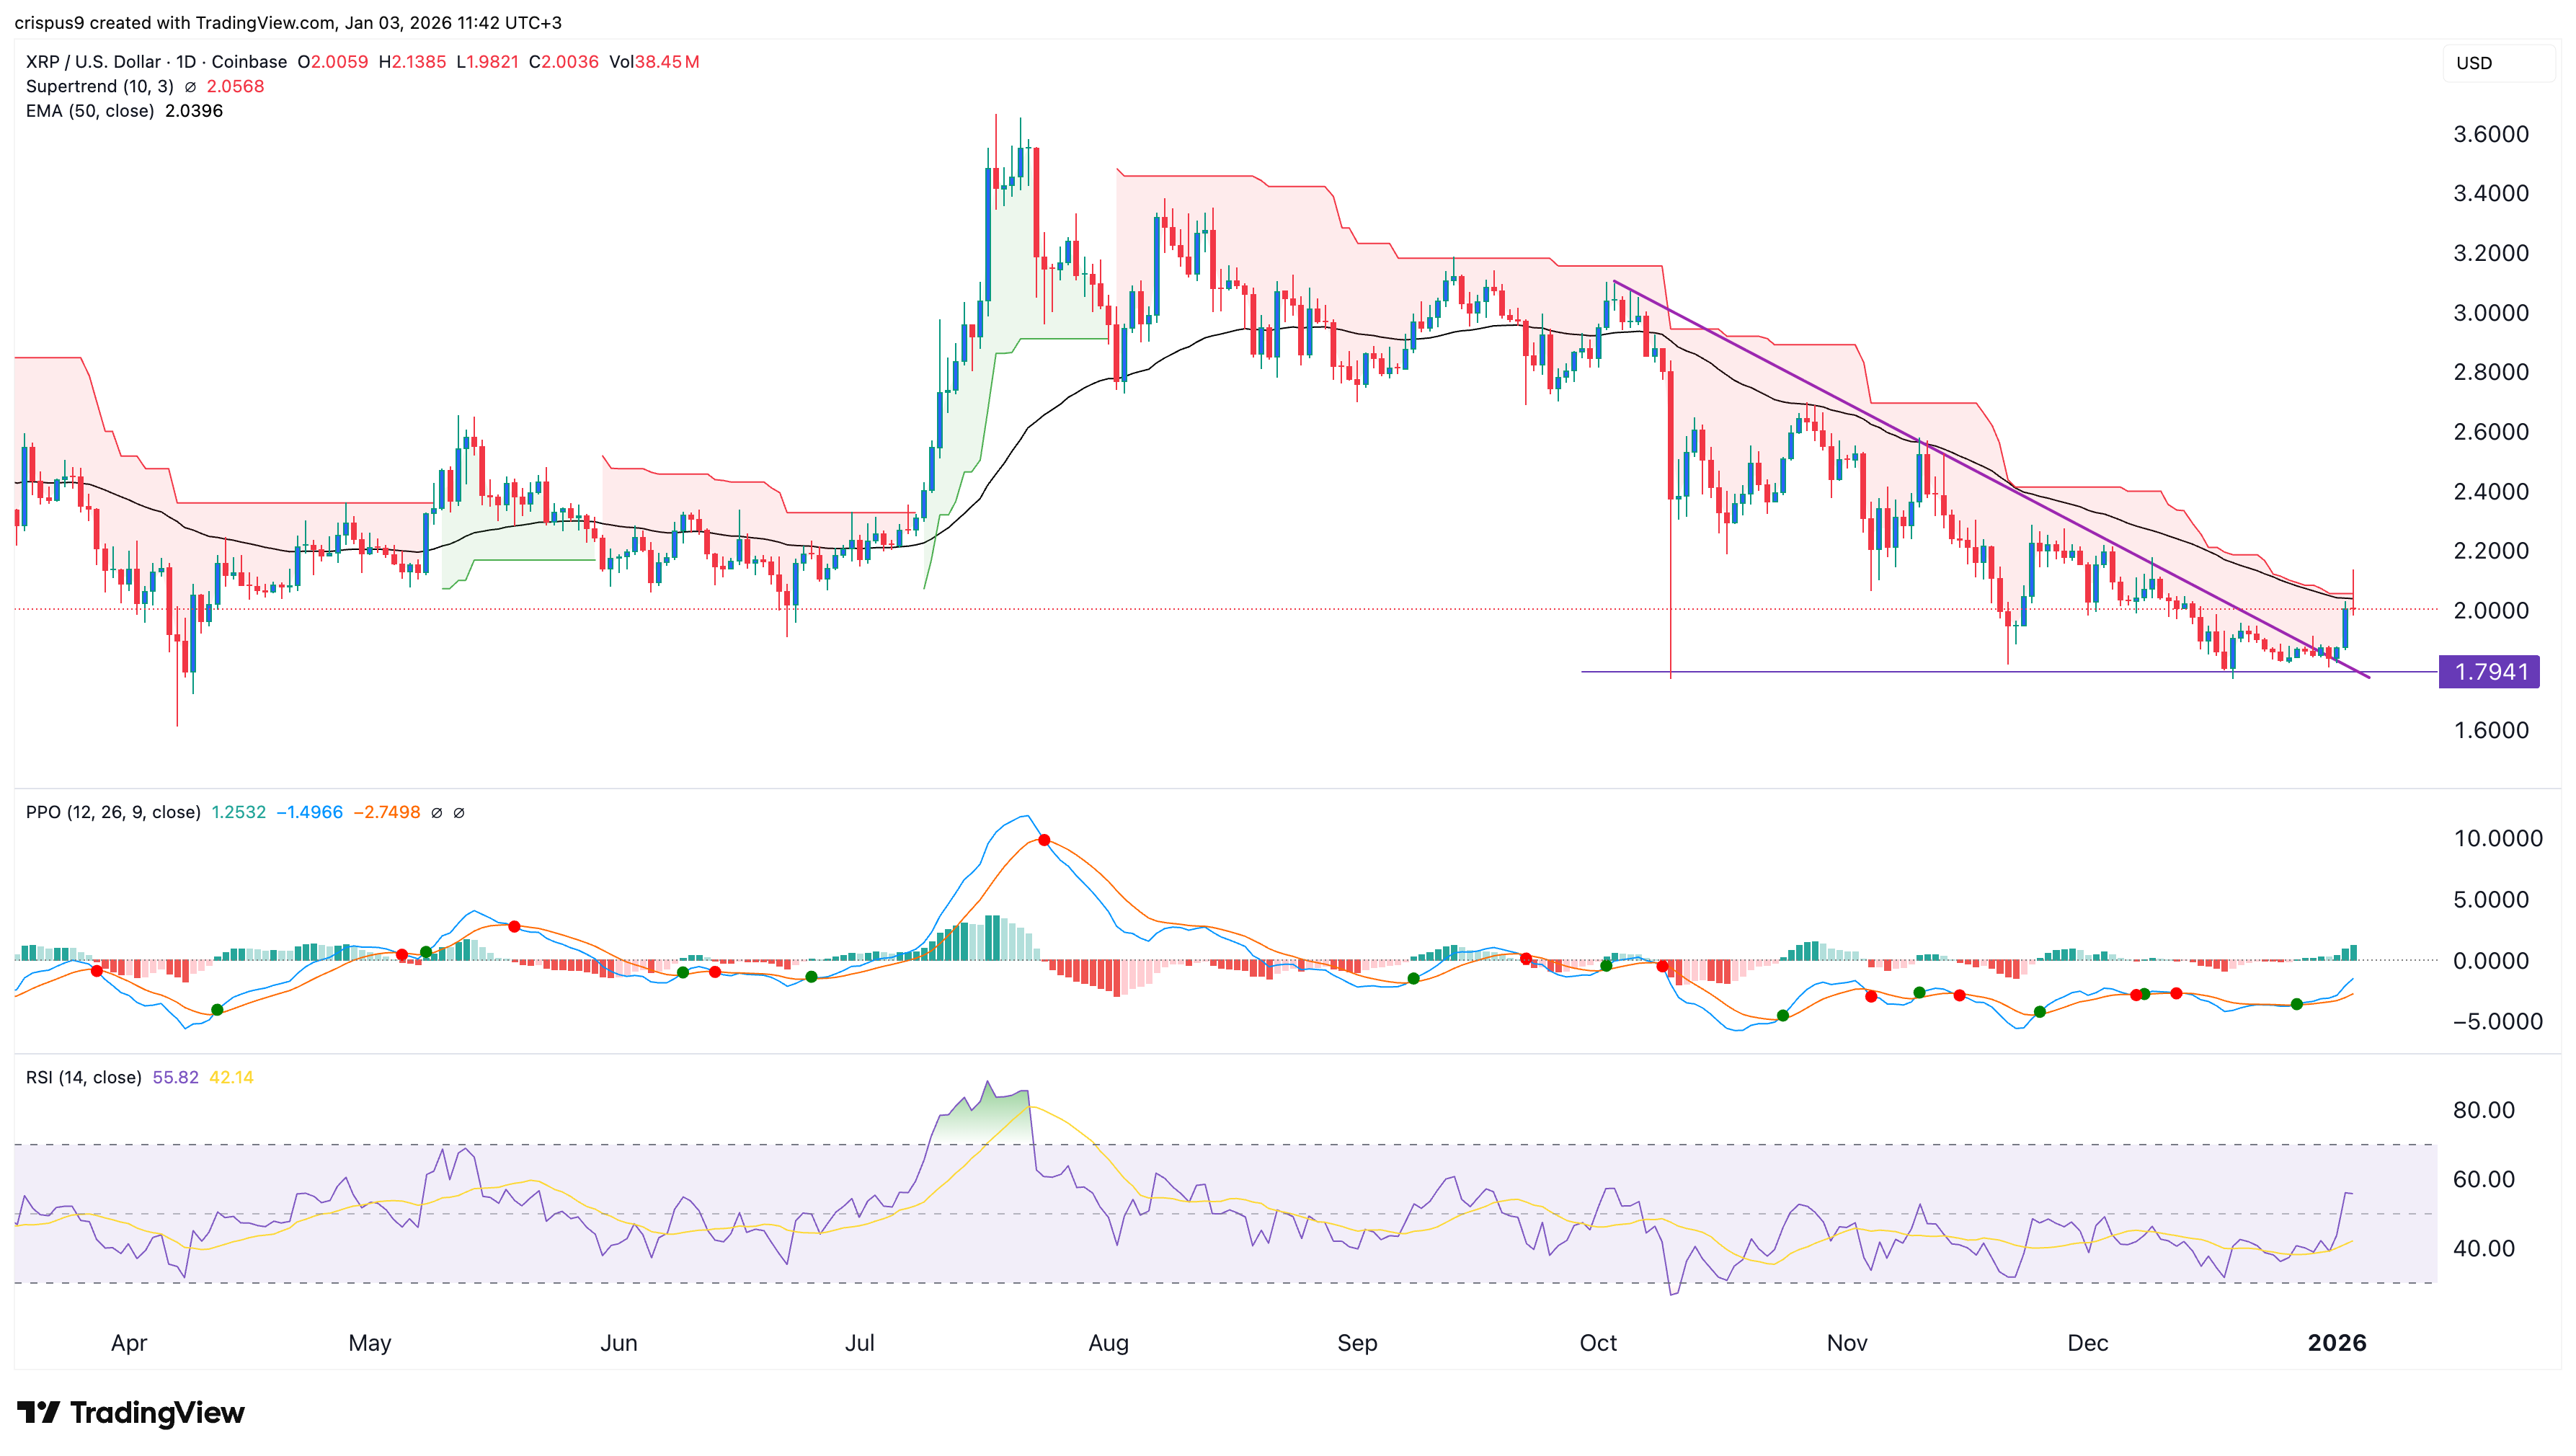
A closer look at the daily and weekly charts shows that the Ripple price is sending mixed signals. On the positive side, the daily chart shows that the coin has formed a triple-bottom pattern at $1.7940, its lowest point in October, November, and December. This price has provided it with substantial support over the past months and is a sign that bears are hesitant to place trades below it.
However, one can also argue that the support was the lower side of the descending triangle pattern. For one, it lacks a neckline, which is required for a triple- or double-bottom pattern.
On the positive side, the coin has moved above the descending trendline, invalidating the bearish outlook. Still, there is a risk that the breakout is a fakeout as the coin remains below the Supertrend indicator and the 50-day and 100-day moving averages.
Another positive is that the two lines of the Percentage Price Oscillator (PPO) have crossed above and are pointing upward. The Relative Strength Index has also moved above 50 and is moving higher.
Therefore, this chart suggests it is still too early to buy XRP. The potential buying signal will be confirmed when the Supertrend indicator flips green. The last time it did that was in July last year, and the token surged to a record high after that.
Also, the coin needs to move above the 50-day and 100-day MAs to confirm a complete bullish breakout. If this happens, it will jump to the next psychological point at $2.5, which is about 25% above the current level.
This is the most likely case as the XRP token has also formed an inverse head-and-shoulders and a falling wedge chart pattern.
READ MORE: Chainlink Price Prediction as Strategic LINK Reserve Buying Soars
Ripple Price Weekly Analysis Shows a Double-Top Pattern
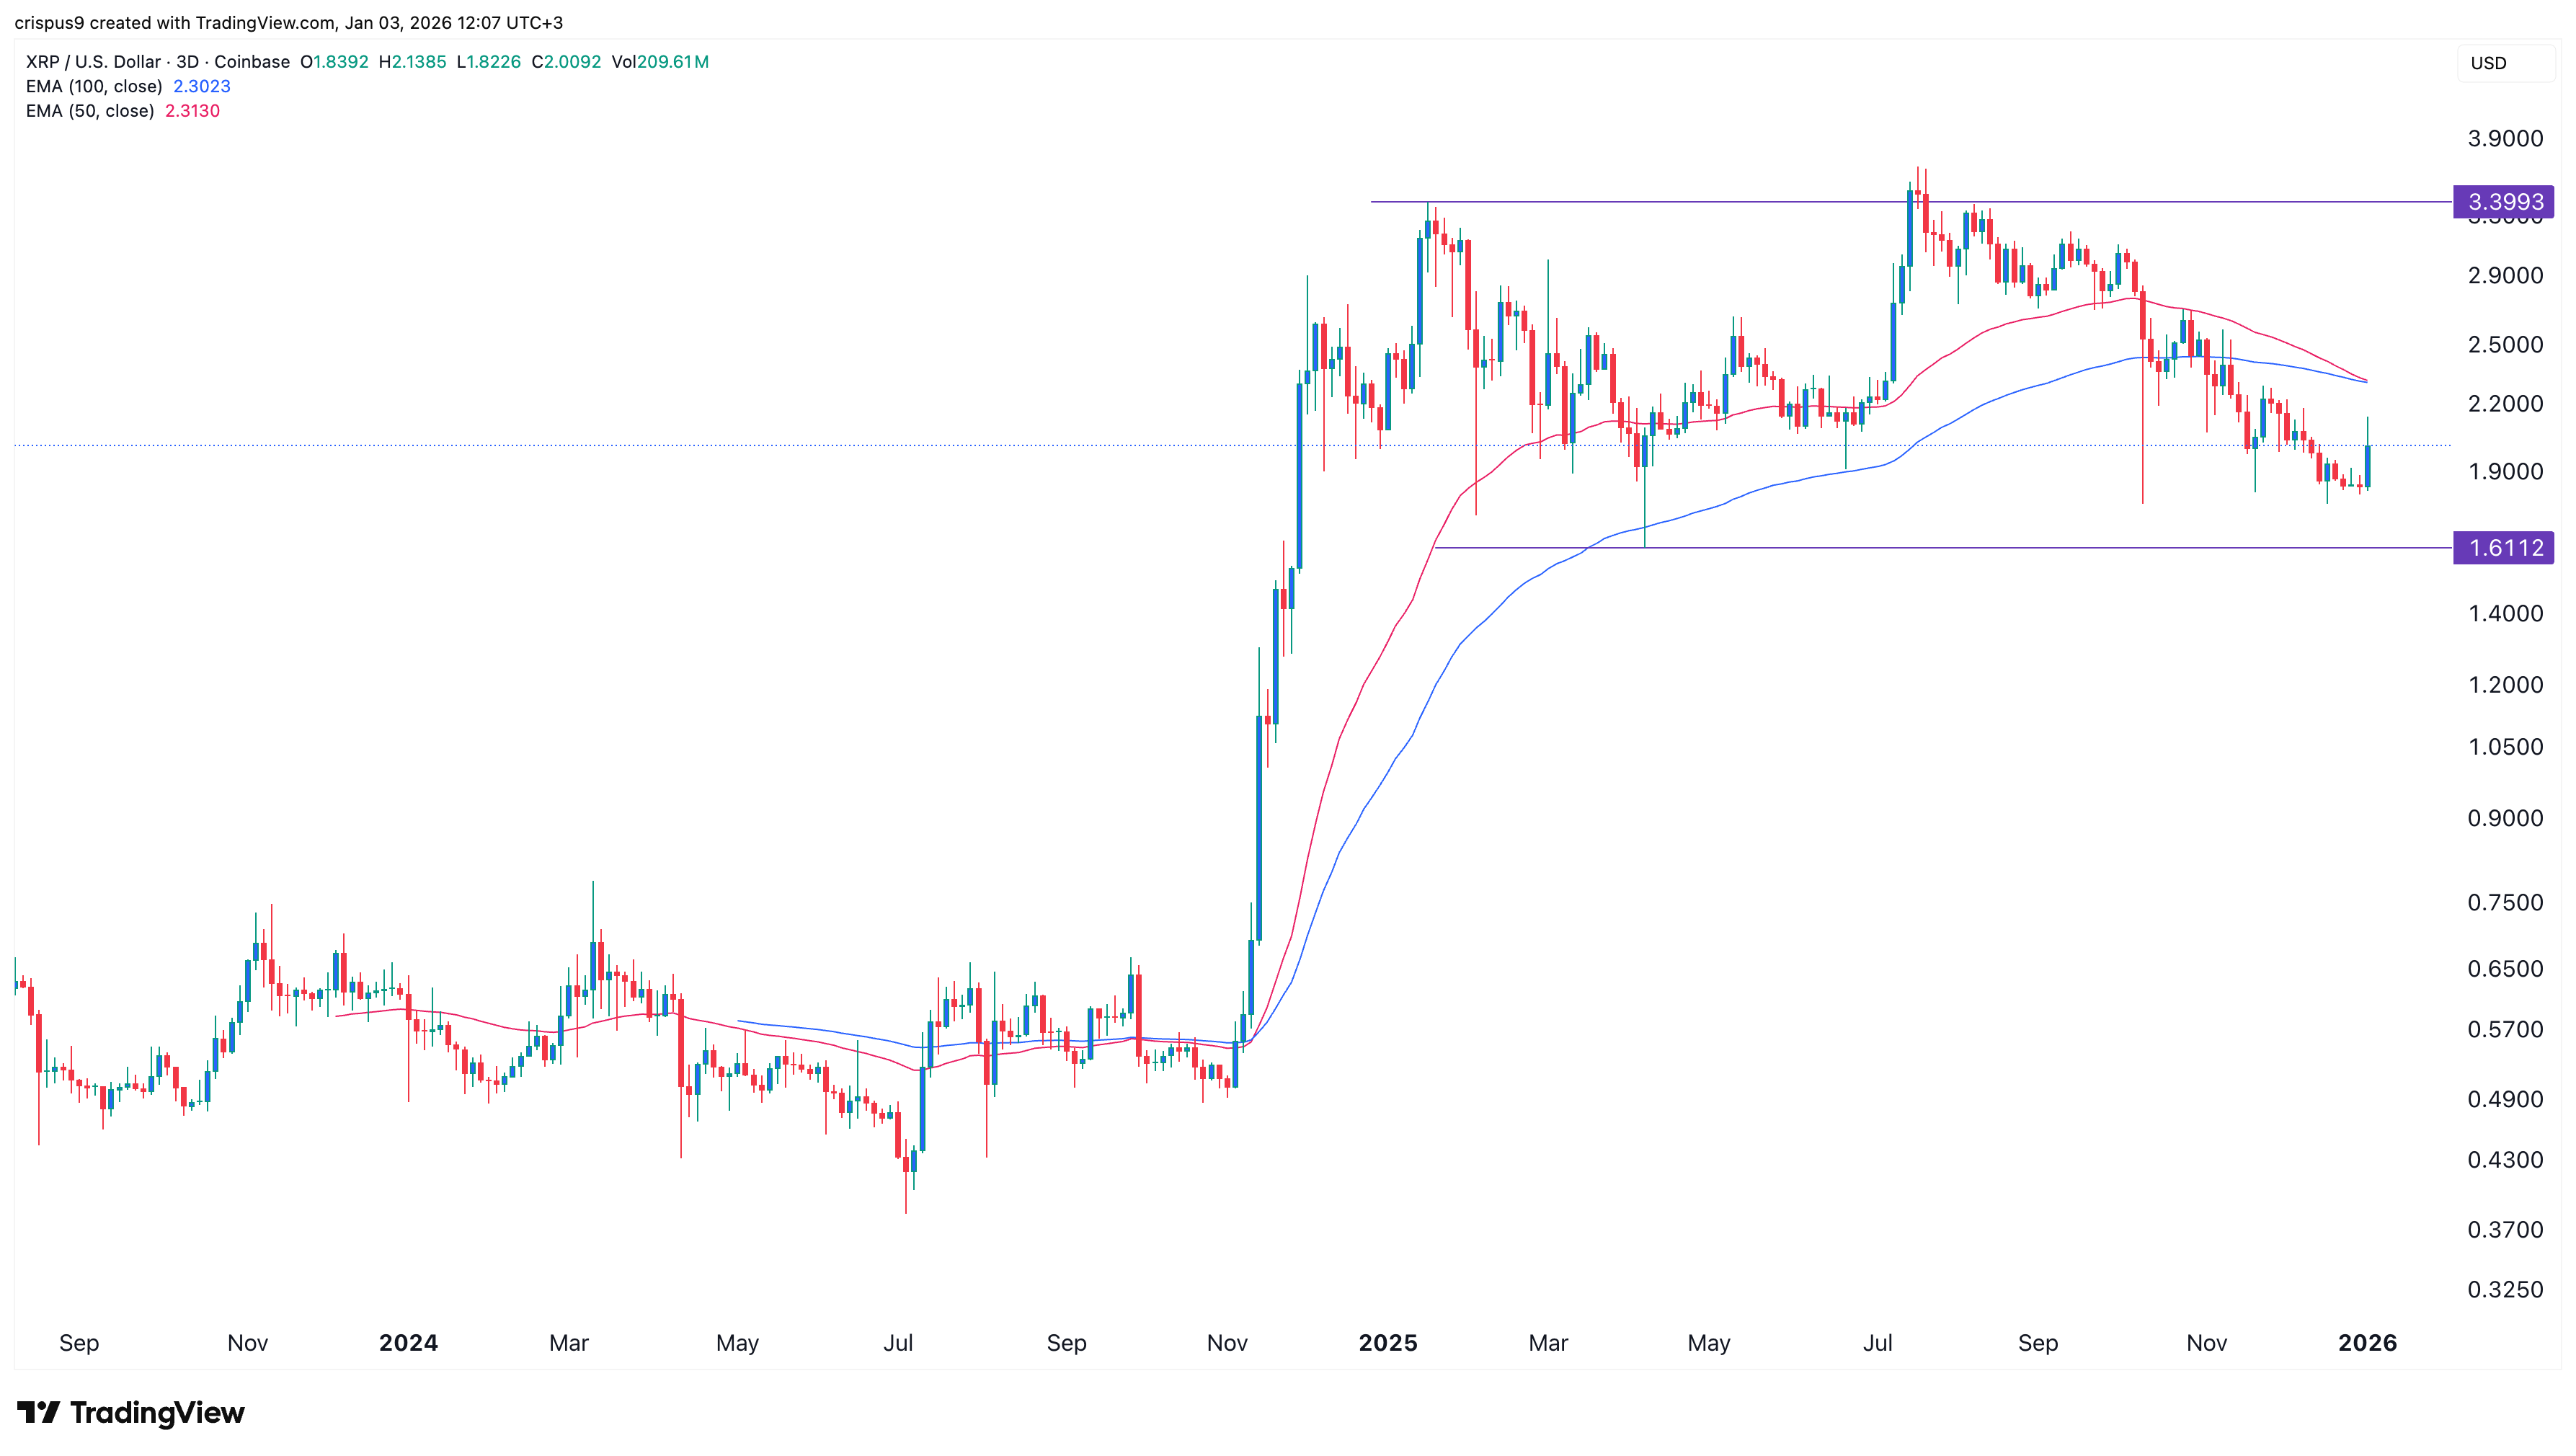
The three-day chart is more straightforward. It has formed a double-top pattern at $3.40 and a neckline at $1.6112. A double-top is one of the riskiest patterns in technical analysis.
As on the daily chart, it has formed a mini death cross pattern, with the 50-day and 100-day Exponential Moving Averages (EMAs) crossing. That is a sign that bears are still in control for now.
Therefore, the token will likely continue falling in the near term, potentially to the next key support at $1.6112. A drop below that level will point to more downside, potentially to the key support at $1.50.
XRP Has Major Catalysts Ahead
The XRP token has several bullish catalysts ahead. One of these catalysts is the ongoing accumulation by American investors who have pushed the total inflows past the $1 billion mark. These funds now hold over $1.24 billion in assets, meaning that they may hit the $8 billion mark later this year if the trend continues.
At the same time, the supply of XRP tokens on exchanges has continued to fall over the past few months. Data show that this supply plunged by over 50% in 2025, a sign that investors continued to accumulate the tokens.
Meanwhile, there are signs of increased demand for staked XRP products, as evidenced by the recent launch of Flare products. As the chart below shows, the amount of staked XRP tokens on Flare has continued rising, and now stands at $136 million, with holders earning double-digit returns.
XRP price may also rebound if the crypto market rally accelerates this year, as it happened on Friday.
READ MORE: Will Pi Network Price Rally in 2026? Yes, If These Things Happen