Crypto prices will experience heightened volatility this week as the Bureau of Labor Statistics (BLS) releases the headline Consumer Price Index data, the Supreme Court issues its decision on Donald Trump’s tariffs, and several Federal Reserve officials speak. This article provides predictions for top coins, including Ripple (XRP), Pepe Coin (PEPE), and Cardano (ADA).
XRP Price Prediction: Technical Analysis
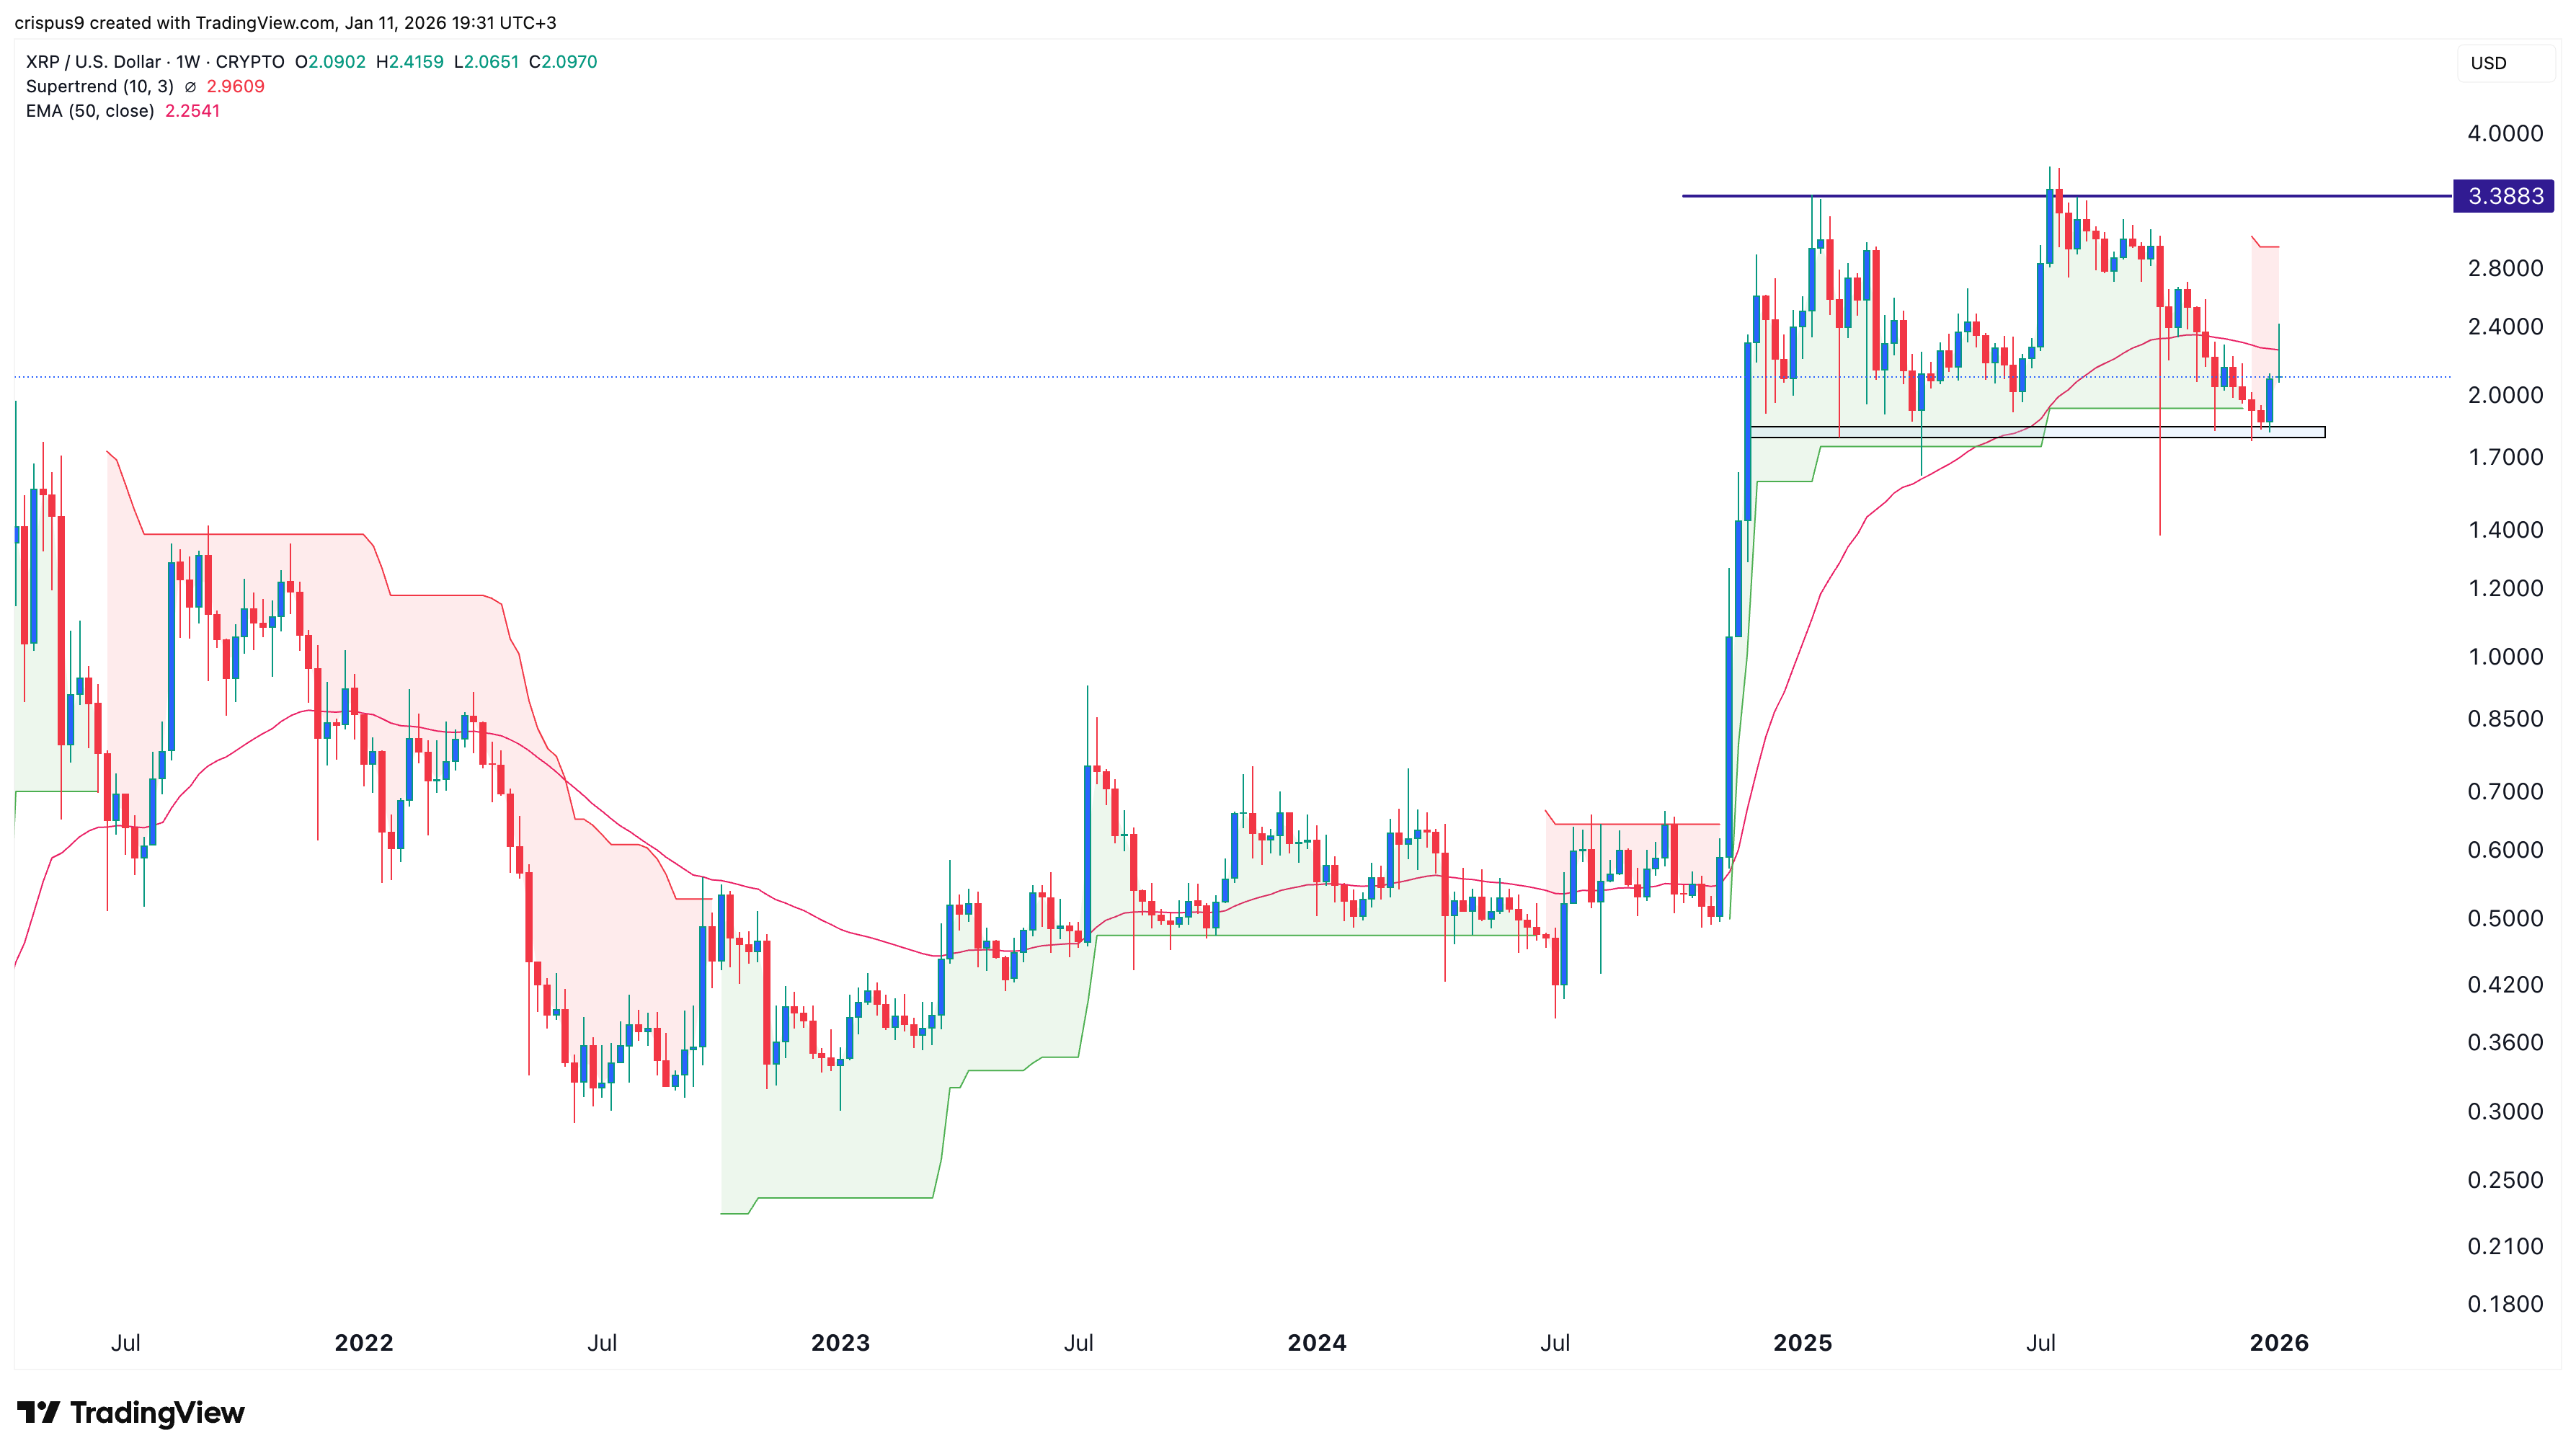
The weekly timeframe chart suggests the XRP price could be at risk of a significant drop this week. For one, the token has moved below the Supertrend indicator, a move that often leads to more downside over time.
Most importantly, the token has formed a gravestone doji candlestick pattern, which is characterized by a long lower shadow and a tiny body. This pattern means a token opened higher, then retreated and closed at its opening price.
The token has also moved below the 50-week Exponential Moving Average (EMA), a sign that bears remain in control for now. It also formed a double-top pattern at $3.3883 and a neckline at $1.560.
Therefore, the token may be at risk of a deep drop in the near term. If this happens, the initial target to watch will be at $1.80, the double-top’s neckline.
READ MORE: Crypto News Catalysts for Next Week: Market Structure Bill, SCOTUS, CPI
Pepe Coin Price Prediction
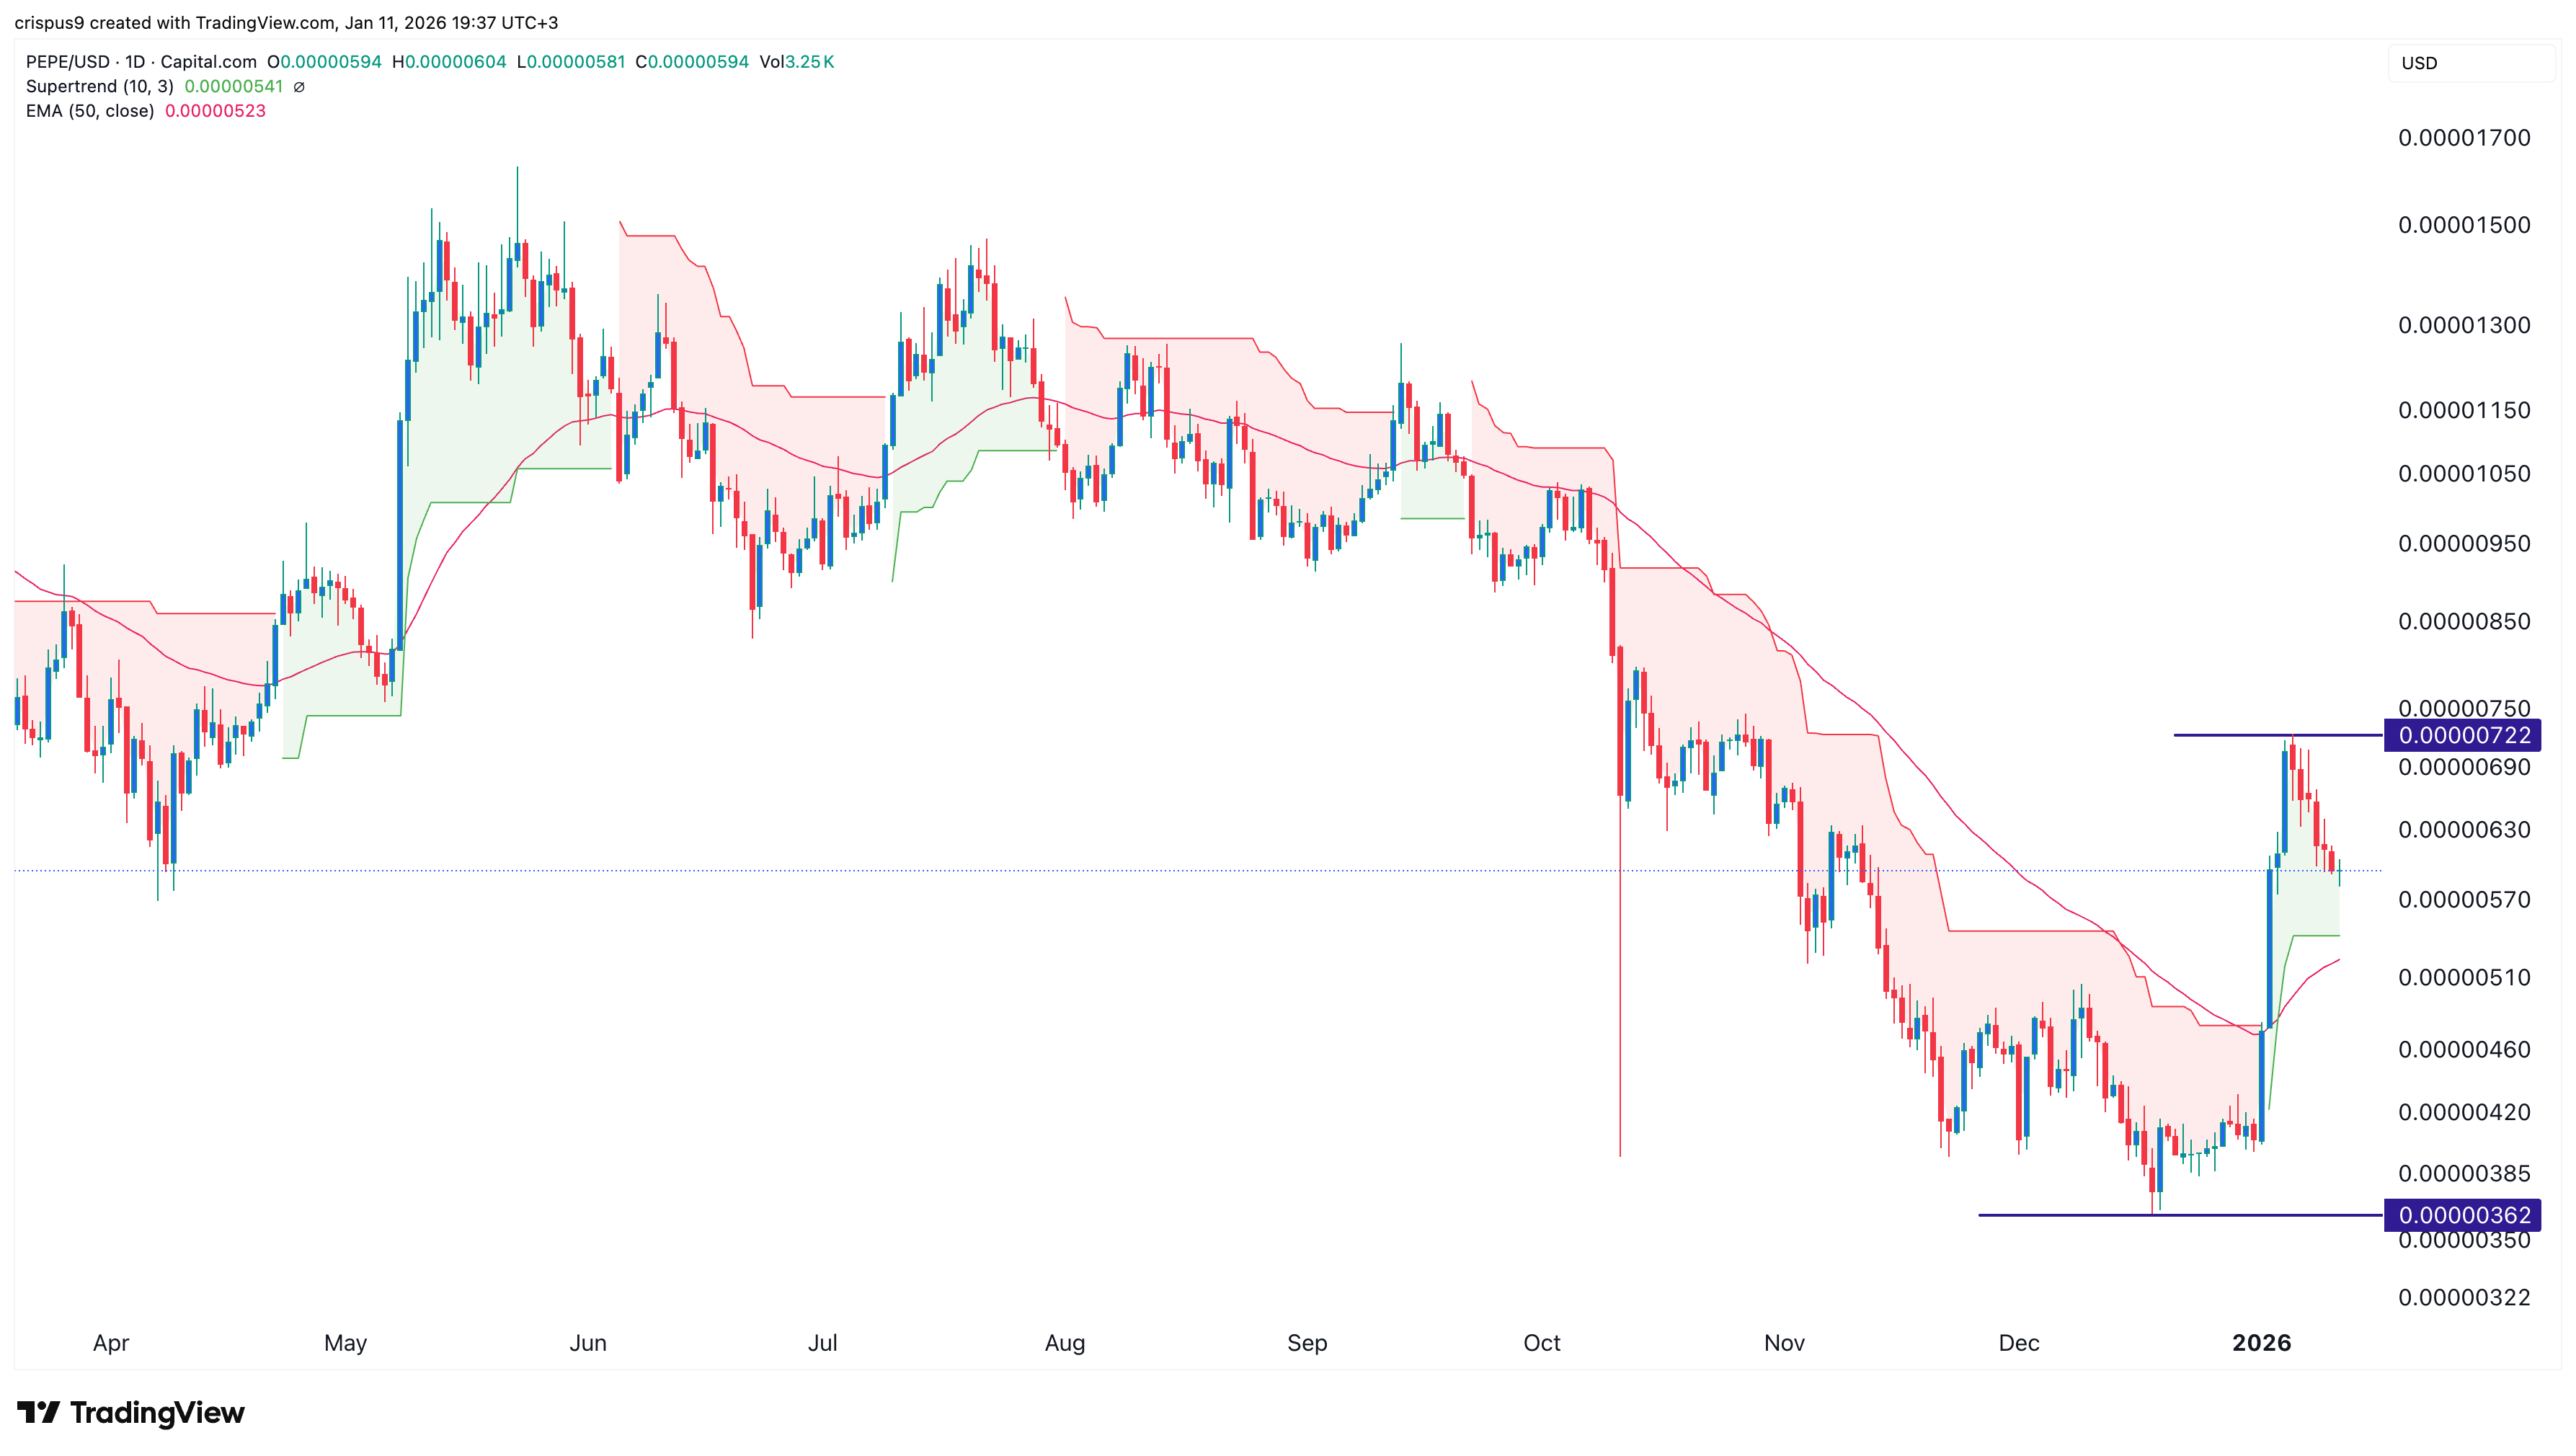
The daily timeframe chart shows that the Pepe Coin price has rebounded over the past few months, rising from a low of $0.00000362 in November to a high of $0.0000072 on January 4, as meme coins soared.
It has then pulled back in the past few days, reaching a low of $0.000000590. On the positive side, the token remains above the Supertrend indicator, a sign that bulls remain in control. It has also moved above the 50-day Exponential Moving Average.
There are signs that the downtrend’s momentum is fading, as the Average Directional Index (ADX) has started to move downward.
Therefore, the token will likely resume the uptrend and possibly retest the key resistance level at $0.0000072, which is about 20% above the current level.
Cardano Price Technical Analysis
The daily timeframe chart shows that ADA price has pulled back from the year-to-date high of $0.4347 to the current $0.40. It has dropped below the upper side of the descending channel, and it remains below the 50-day Exponential Moving Average.
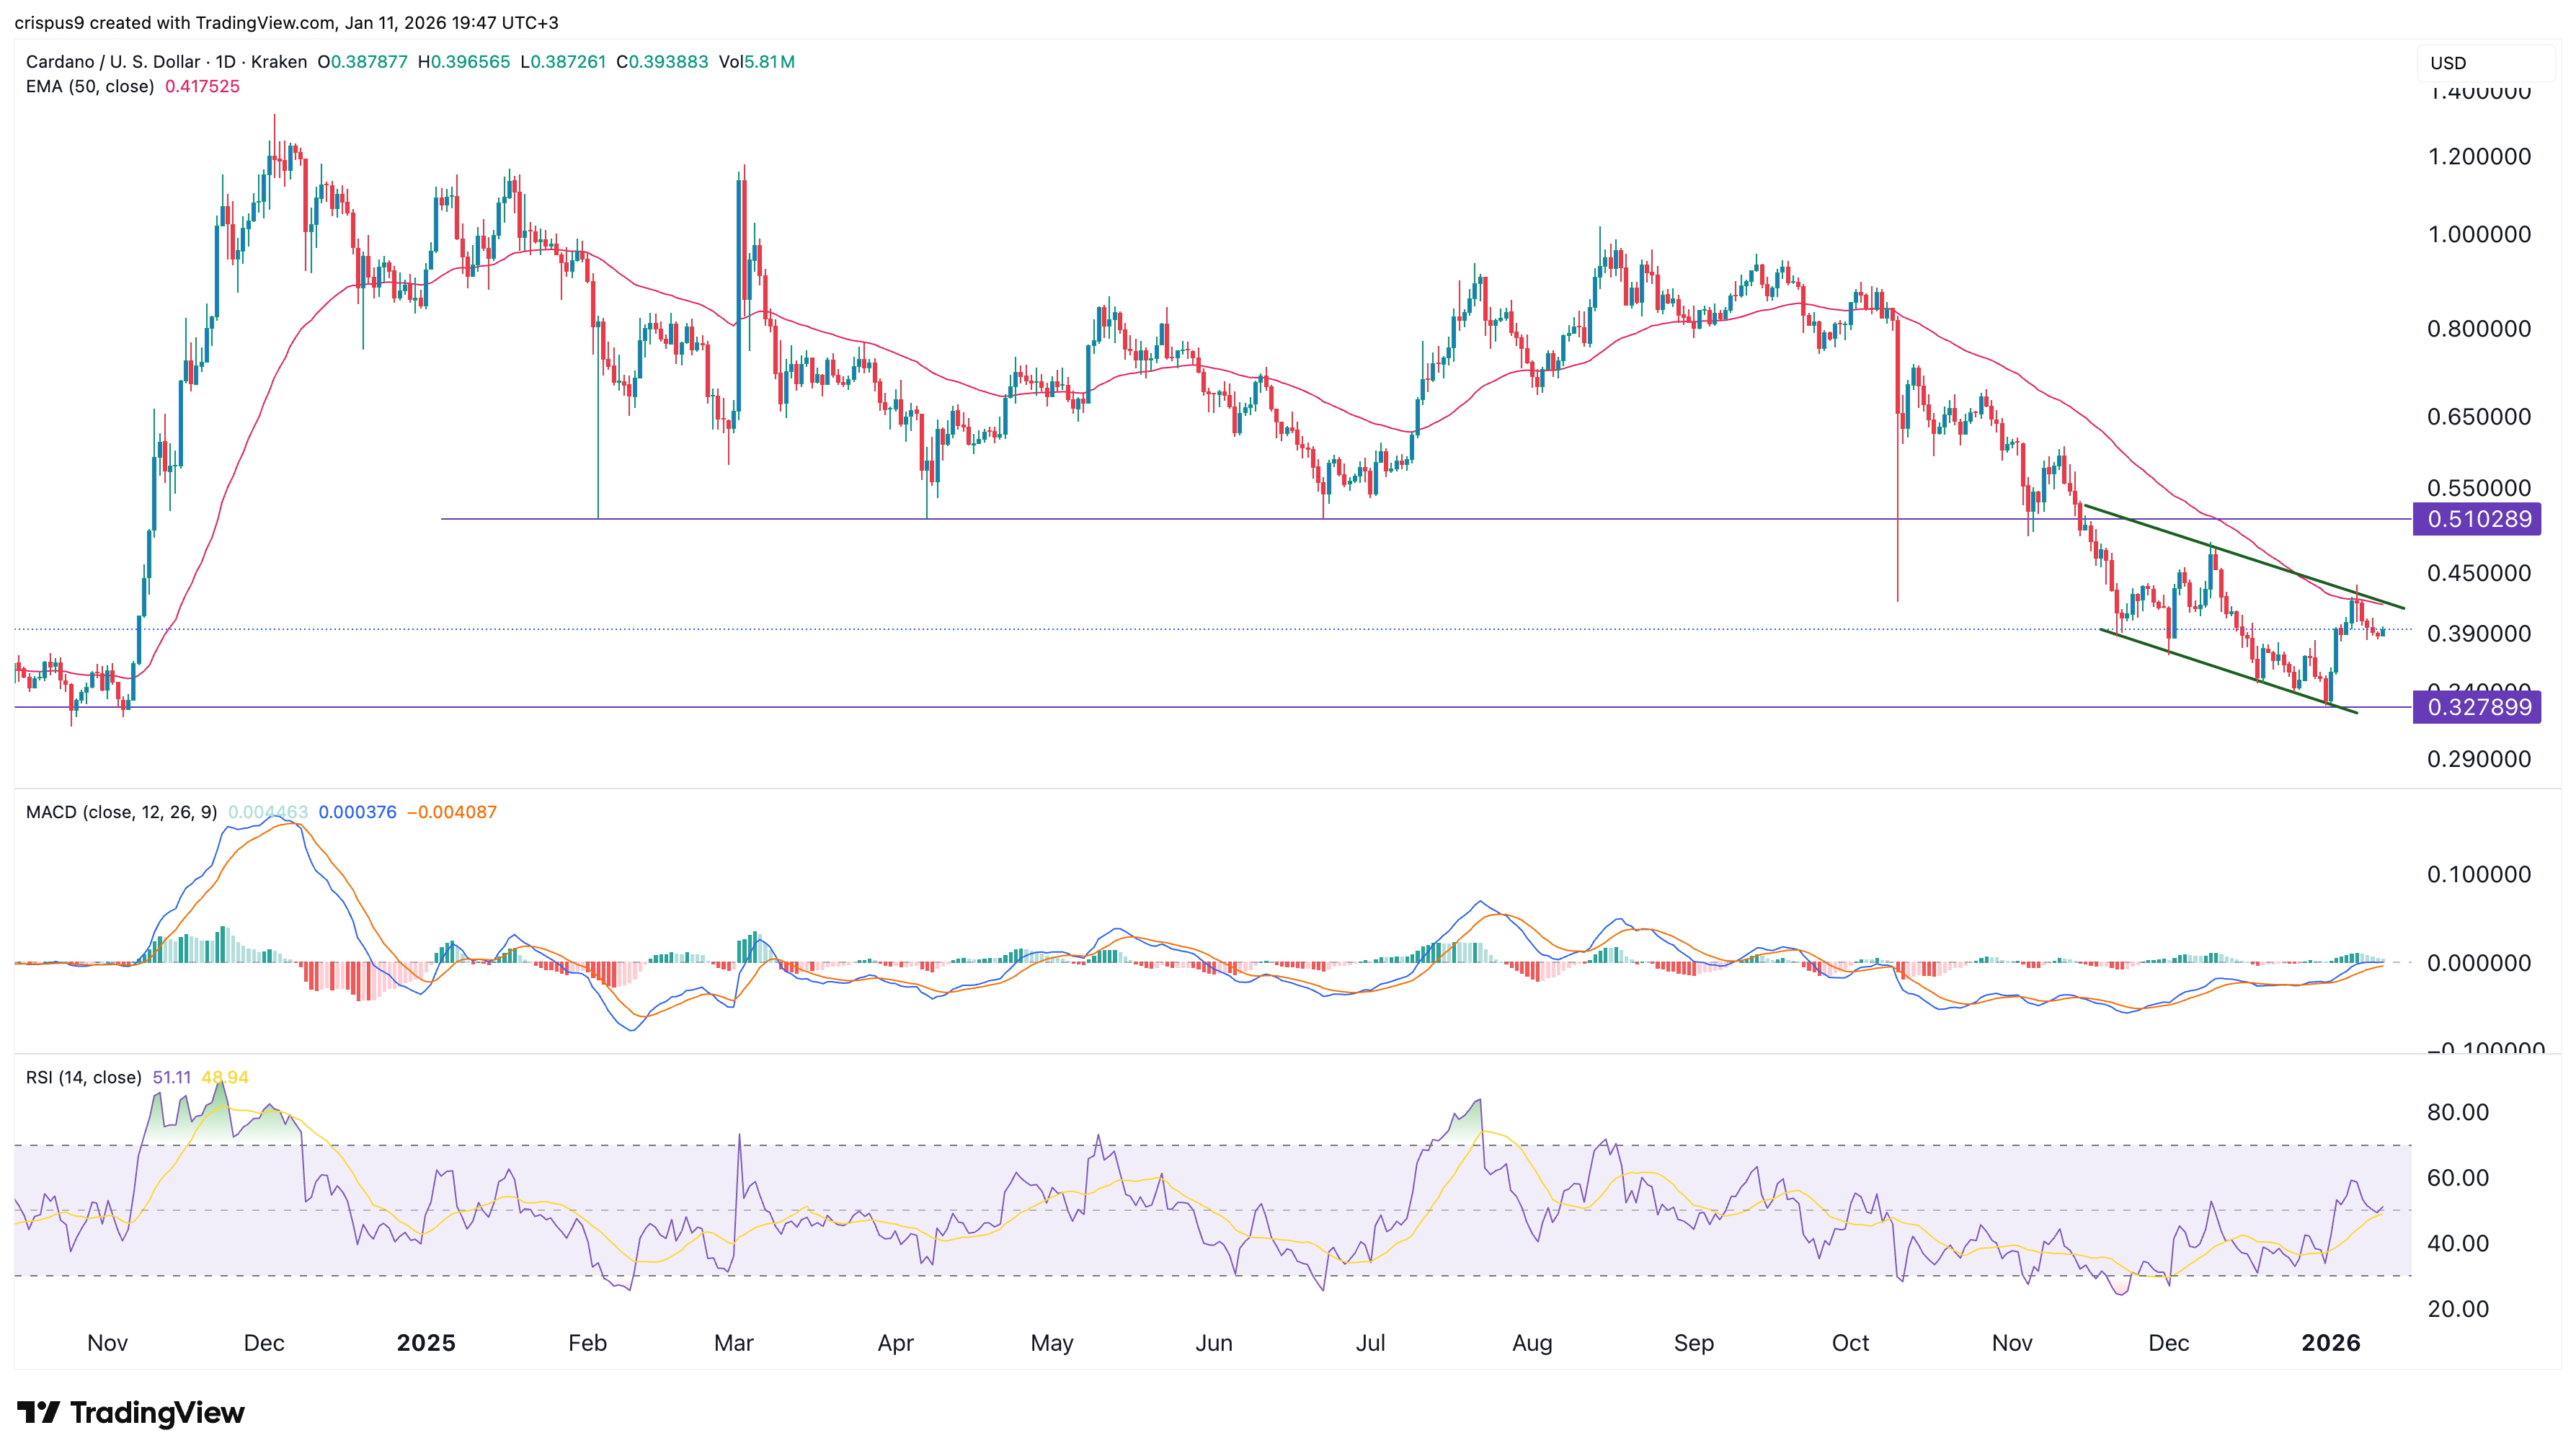
The MACD indicator has stagnated slightly below the zero line, while the Relative Strength Index (RSI) has retreated to 50. The most likely scenario is that the token continues to fall as long as it remains below the descending channel and the 50-day moving average. Such a move may see it drop to the key $0.3278 support level.
READ MORE: Top Crypto to Watch This Week: Polygon, Binance Coin, Pi Network