


Ethereum price has moved sideways in the past few days as sentiment in the crypto industry waned. ETH has remained solidly above the key $3,000 support level and has formed a rare bullish chart pattern on the weekly chart. Also, there are signs that Ethereum has become highly undervalued.
Fundamentals Support an Ethereum Price Rebound
Ethereum has some of the best fundamentals in the crypto industry, which explains why BitMine has continued to accumulate it in the past few months. It has bought over 4 million tokens and is on track to own 5% of the supply.
Data show that Ethereum is now highly undervalued relative to other networks. For example, data compiled by TokenTerminal shows that Ethereum has a fully diluted market capitalization of over $372 billion, while the application TVL stands at $335 billion.
As the chart below shows, the application TVL has provided a floor for the ETH price for over five years. The main reason is that most applications on Ethereum require ETH as a core input to operate. A good example of this is Aave, which has $20 billion of ETH in deposits. When used as collateral, the deposits allow users to take out loans, creating new demand for ETH.
READ MORE: Coinbase Stock Price at Risk as Base L2 Metrics Plummet
Meanwhile, Ethereum has a market capitalization-to-DeFi TVL ratio of 2.56, much lower than that of other tokens. For example, Solana has 3.83, while Binance Coin has 13.24. Tron has a multiple of 6.16.
Ethereum will likely continue to grow its market share among other networks, as it becomes the most common chain for issuing assets now that its transaction costs have tumbled over the past few months.
Indeed, some analysts believe that there will be no need for layer-2 networks in the future, as Ethereum will have both the speed and the cost to run operations.
Ethereum has a market share of over 75% in decentralized finance (DeFi) and 60% in real-world asset (RWA) tokenization. These numbers are impressive considering that more layer-1 and layer-2 chains have been launched in the past few years. Some of the most notable additions were Ink, Plasma, and Hyperliquid.
Ethereum Price Technical Analysis
The weekly timeframe chart shows that the ETH price has remained slightly above the 100-week Exponential Moving Average (EMA), which is a highly bullish sign in technical analysis.
Ethereum price has also formed a large inverse head-and-shoulders pattern. In this case, the head is at $1,385, the left shoulder at $2,126, and the right shoulder at $2,627. This pattern often leads to a strong bullish reversal over time.
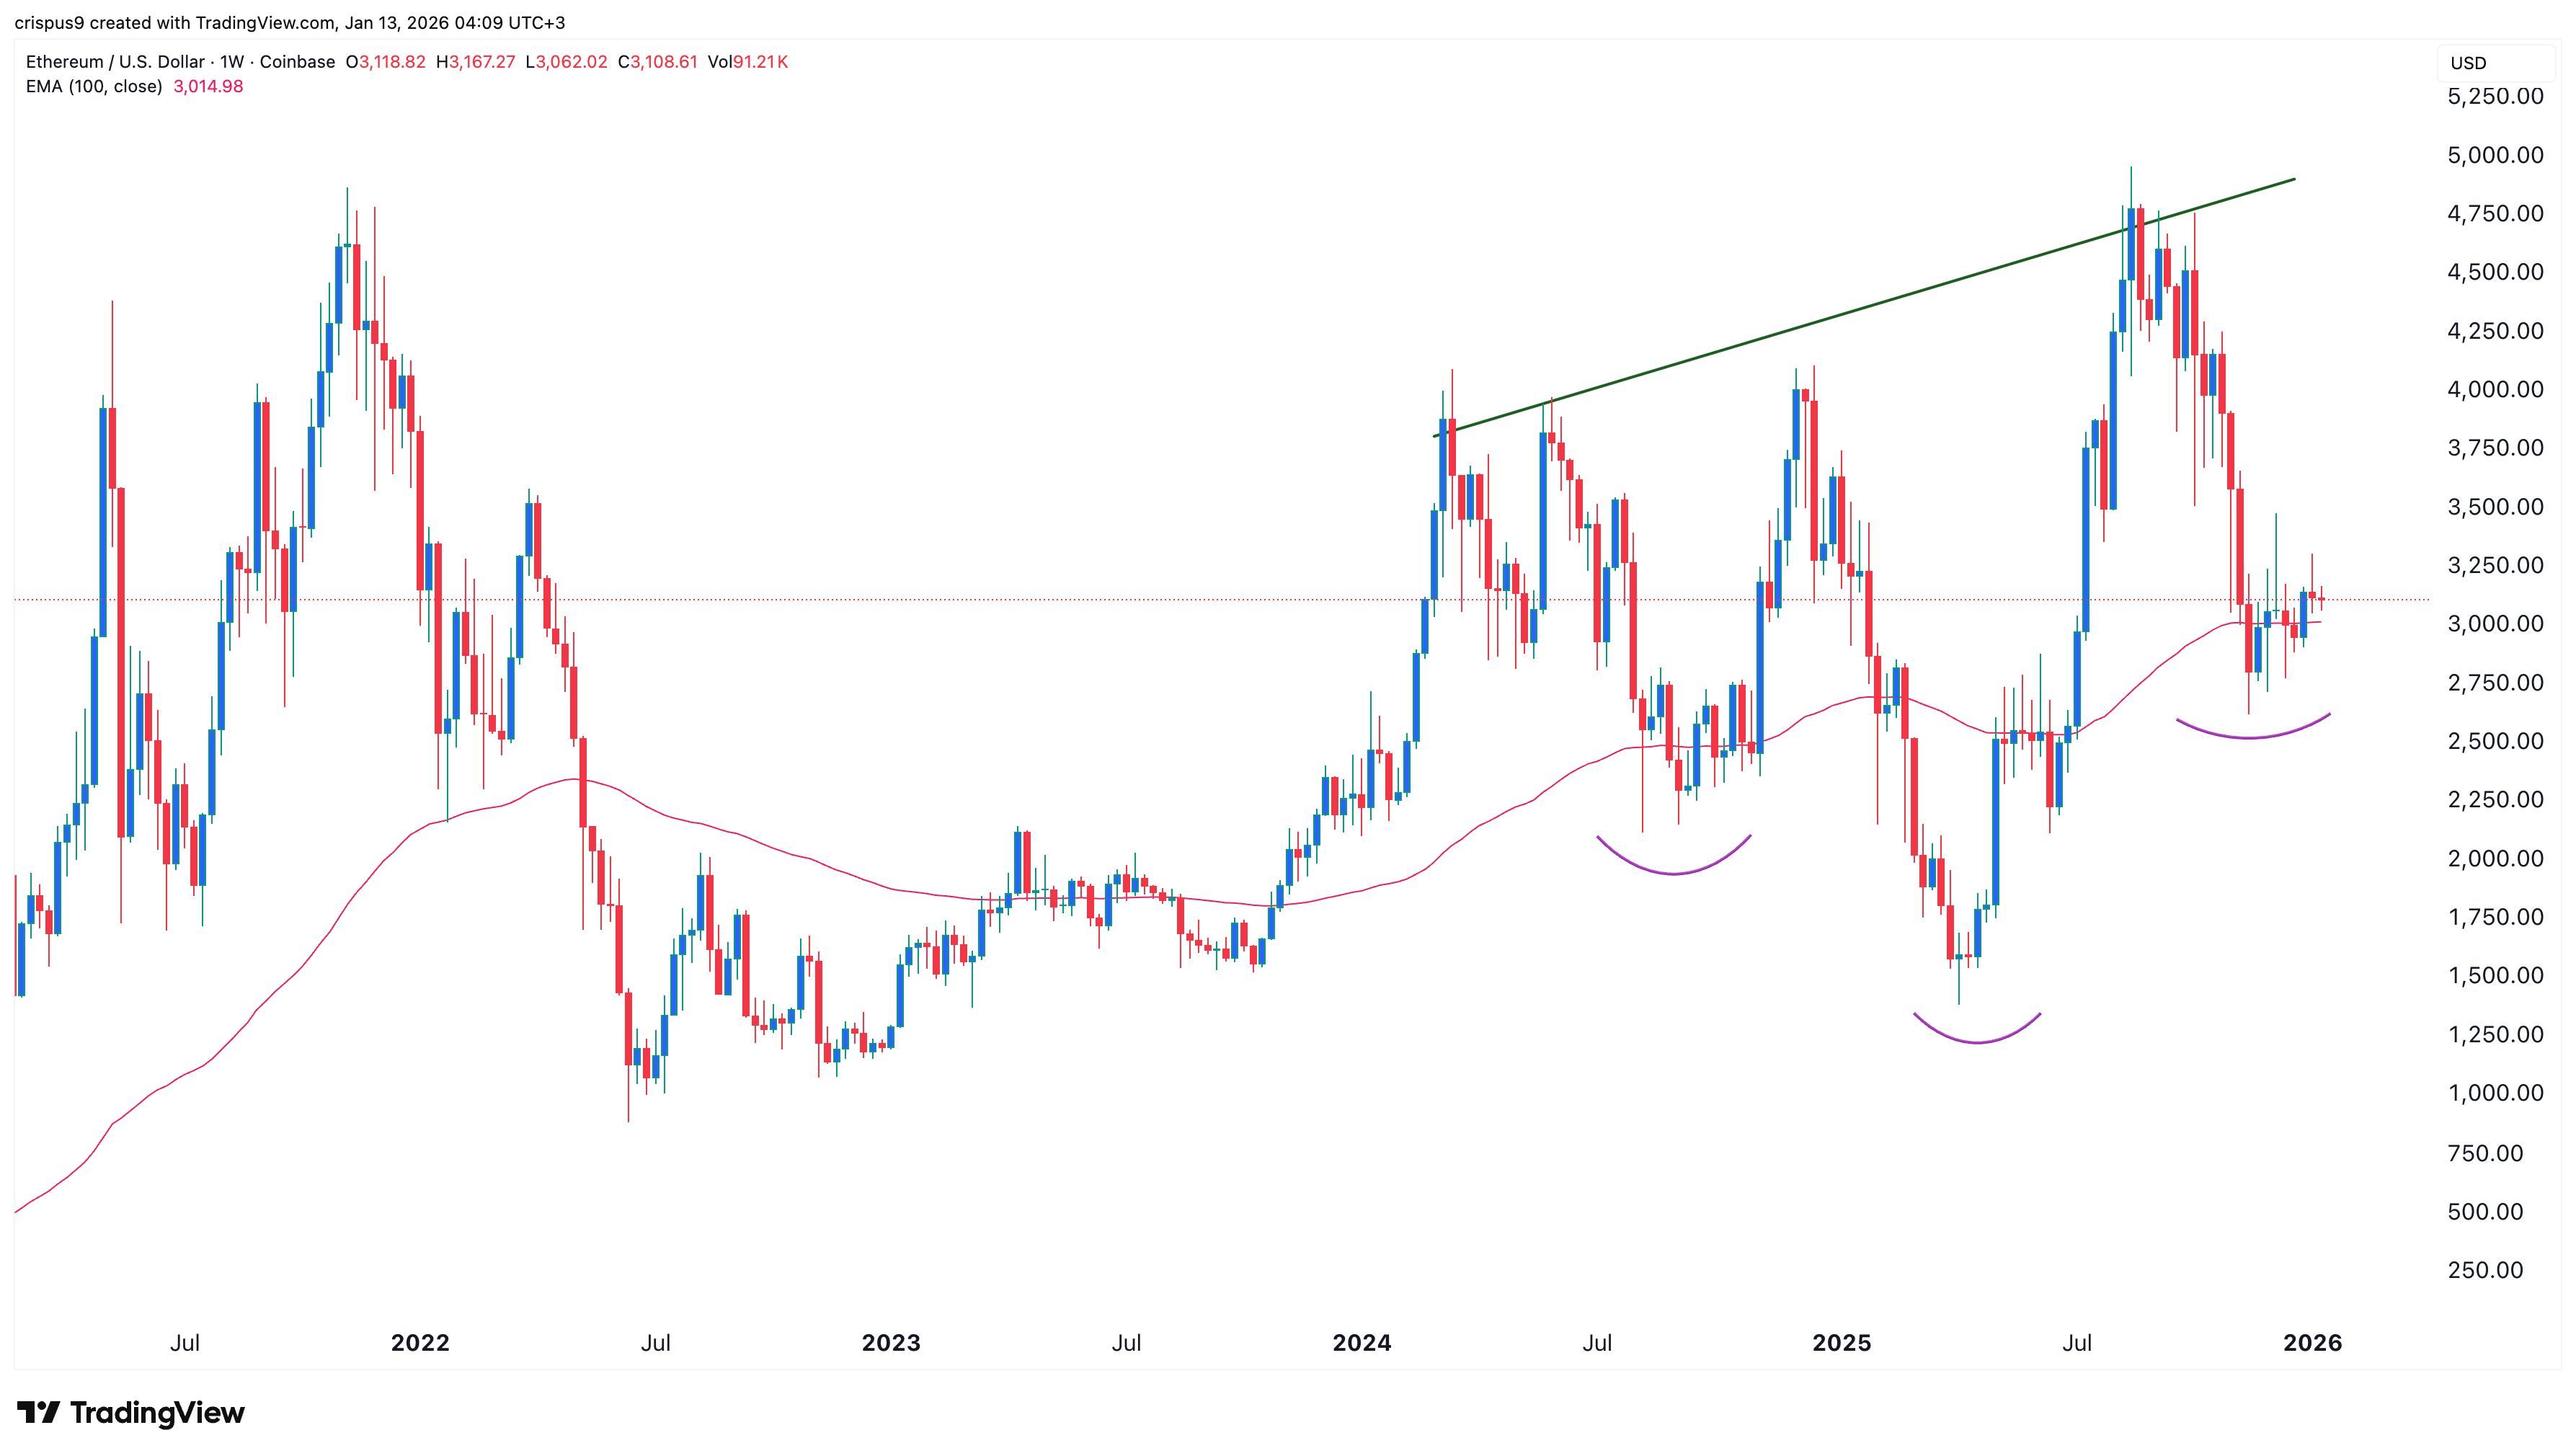
Therefore, the most likely scenario is where it rebounds, especially now that CZ has predicted a potential crypto super cycle. If this happens, the coin is likely to move above the key resistance level at $4,000 soon. A move above that level will point to more gains, potentially to the next key level at $5,000.
However, for this to happen, the ETH price will need to overcome the bearish flag pattern that has emerged on the weekly chart.
READ MORE: BitMine Stock Eyes a Big Move Ahead of a Key Shareholder Vote Deadline