


Solana price pulled back for the second consecutive day after the CLARITY Act stalled in the Senate. It retreated from the weekly high of $146.75 to the current $142. Still, a closer look beneath the surface shows that SOL has the fundamentals and technicals necessary for a rebound.
Solana Has Strong Fundamentals
Third-party data show that Solana’s network is performing well, which may support its recovery. For example, data shows that Solana has become a major player in the real-world asset (RWA) tokenization industry. RWA assets in the network jumped to over $1 billion, up from zero in the same period last year.
Solana is also the most actively used chain in the crypto industry, with its active user base soaring to over 60 million in the last 30 days. This number is much higher than that of other networks, including popular ones like Ethereum and Base.
READ MORE: Elliott Wave Signals Chainlink Price Upswing as Bitwise LINK ETF Launches
Solana is generating some of the highest fees in the crypto industry today. It made over $17 million in fees in the last 30 days as activity in the network soared.
Meanwhile, Solana has overtaken the Ethereum and BSC chains in DEX volume. The network handled over $100 billion in the last 30 days, while the other two chains handled $42 billion and $45 billion combined.
These metrics will likely improve in the coming months when the network launches the Alpenglow upgrade. Alpenglow will dramatically change its architecture and increase its throughput by introducing the Votor and Rotor technologies. It will be launched later this quarter.
Meanwhile, data shows that American investors continue to accumulate Solana ETFs, a sign that they expect the price to keep rising in the near term. These investors have added close to $1 billion in assets this year, and cumulative inflows are nearing $1 billion.
Solana Price Technical Analysis
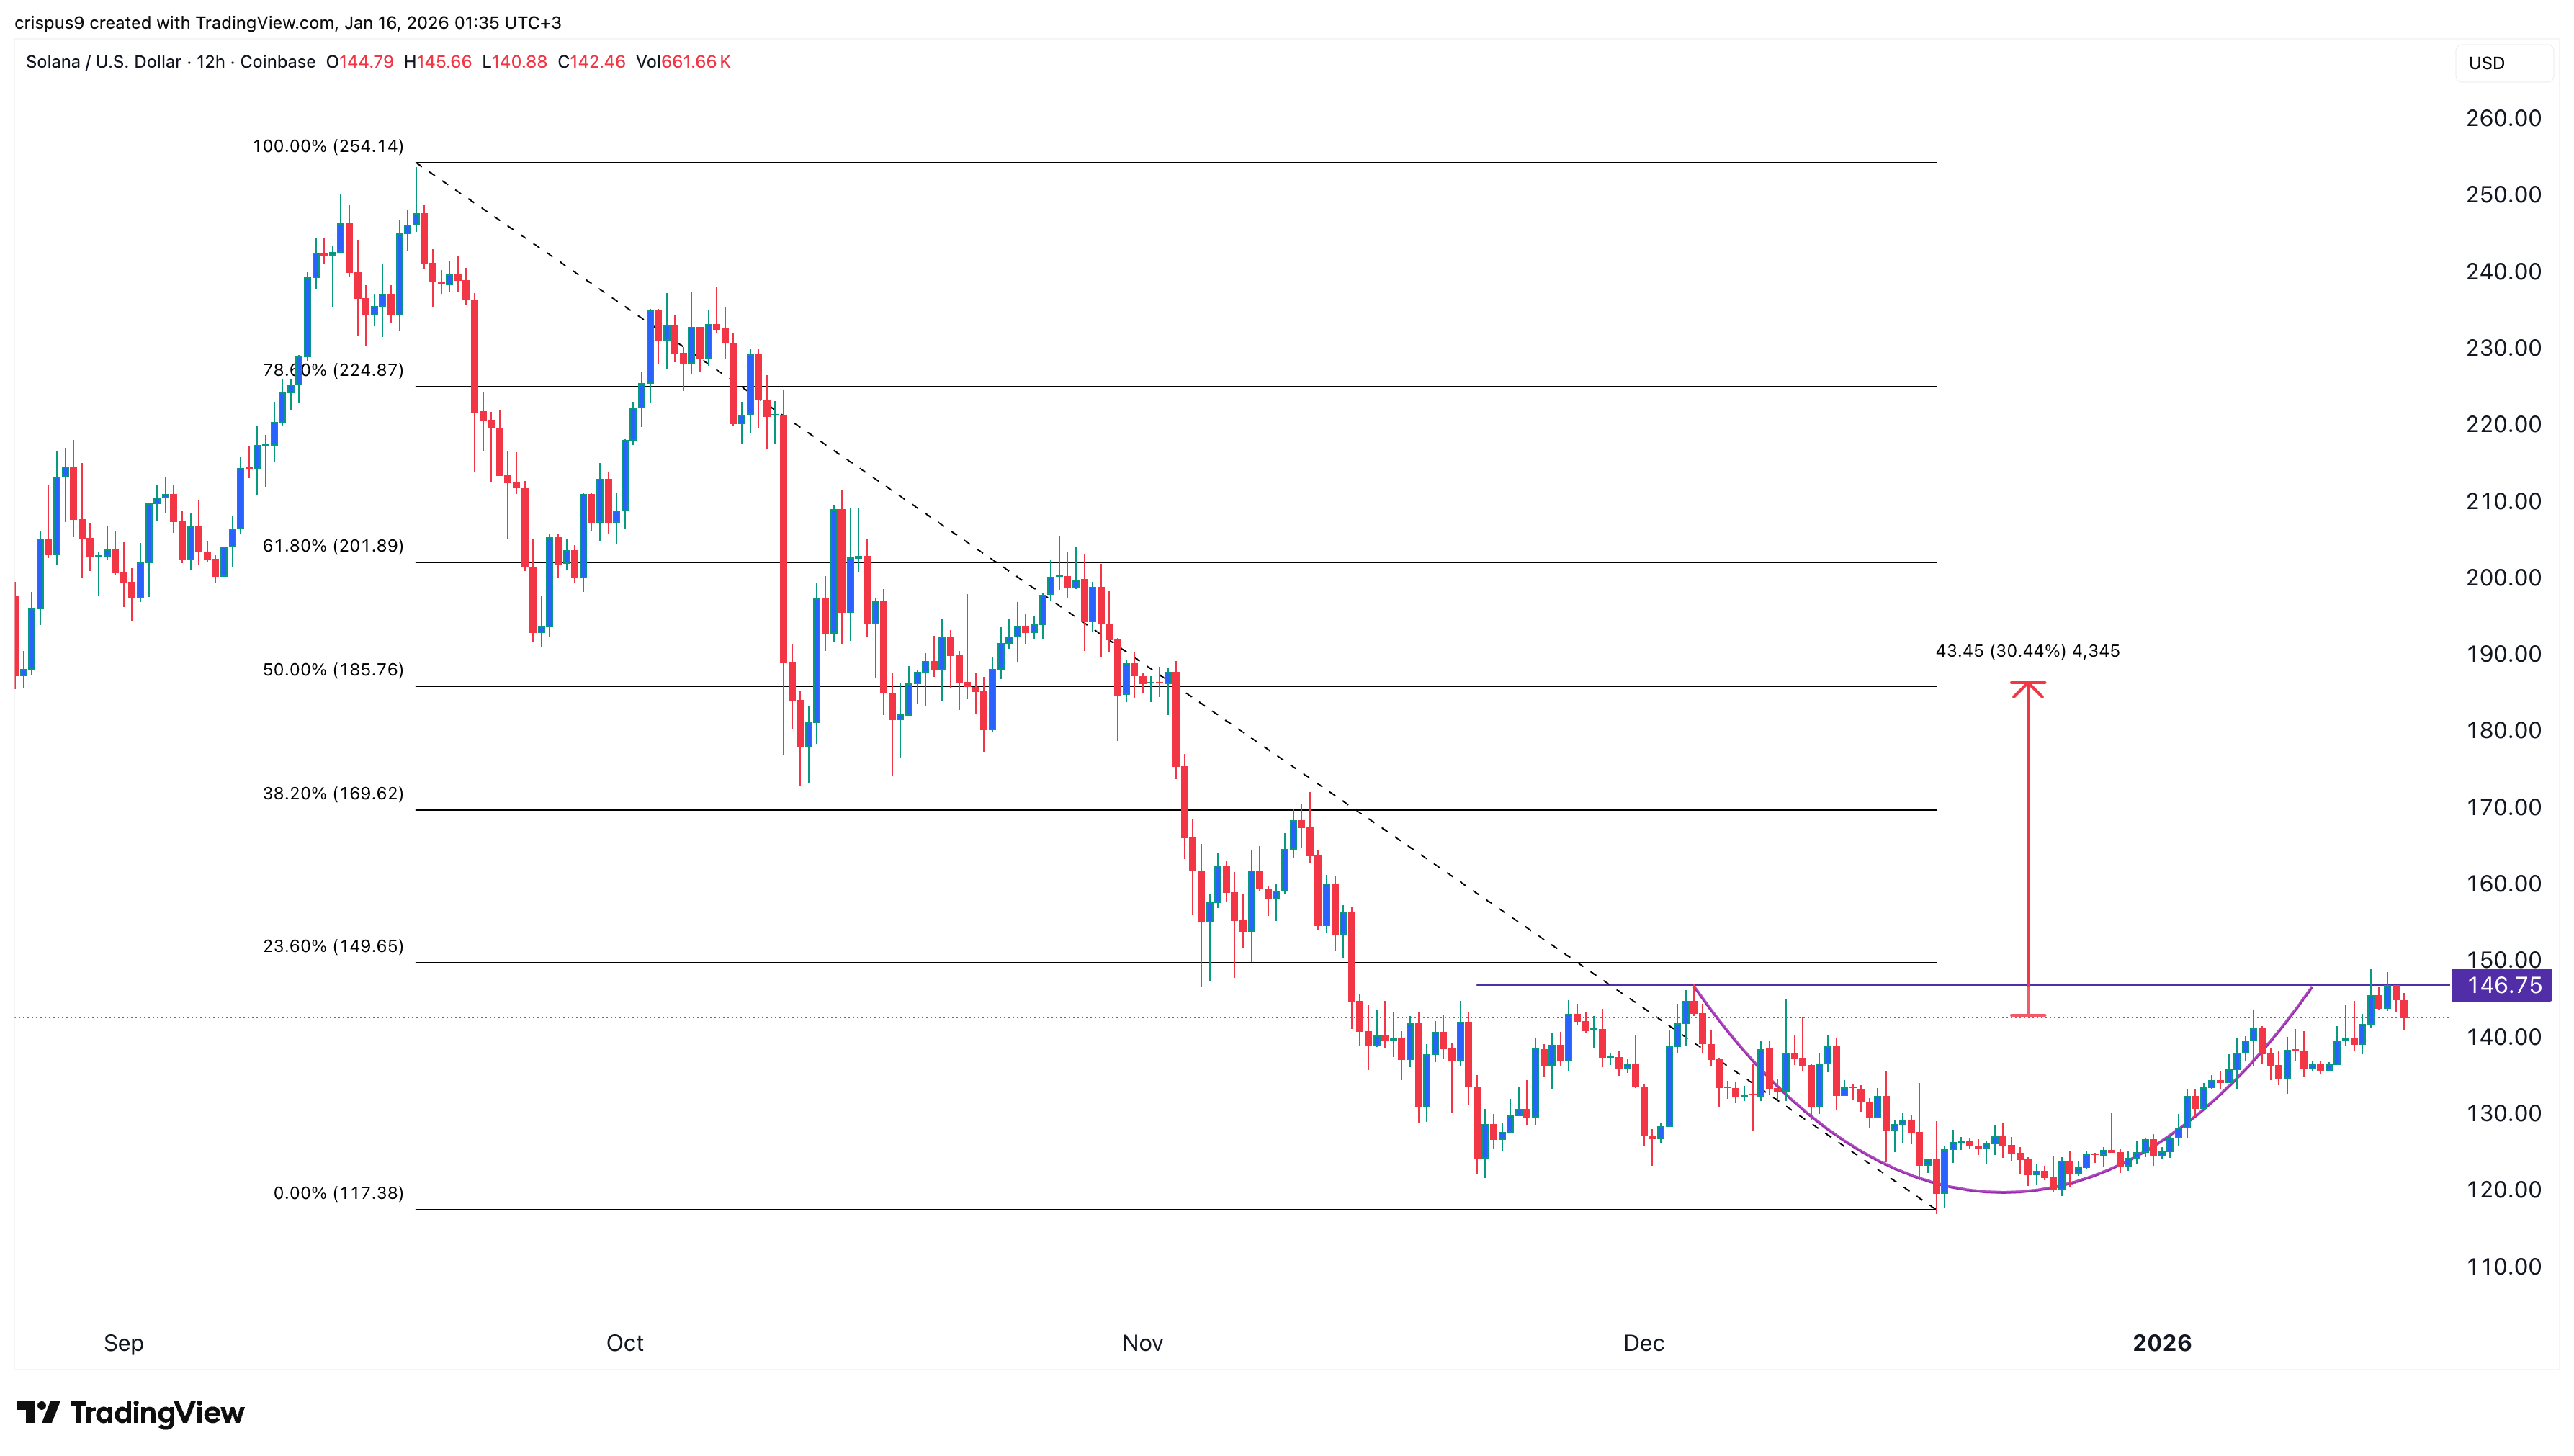
The 12-hour chart shows highly bullish technicals, which will boost Solana’s performance in the near term. It jumped from a low of $117 in December to a high of $146.
The year-to-date high coincided with the 23.6 % Fibonacci Retracement level, which explains why it has pulled back. SOL has also formed a cup-and-handle pattern, which is a common bullish continuation sign.
Therefore, the most likely scenario is that it continues rising as bulls target the 50% Fibonacci Retracement level at $185, about 30% above the current level.
READ MORE: Dogecoin Price Prediction: Here’s Why DOGE May Jump by 30%