


Ethereum price has moved sideways over the past few days despite the ongoing network strength following the Fusaka upgrade. The ETH token traded at $3,295 today, a few points below this week’s high of $3,370. This article explains why the Ether price may crash 20% despite having some of the best metrics.
Key Ethereum Network Metrics are Soaring
Third-party data shows that Ethereum’s network is doing well and has become one of the fastest-growing chains in the crypto industry.
Data compiled by Nansen shows that it was the second-fastest-growing chain in terms of transactions in the last 30 days after Linea. Its transaction count rose by 28% in this period to over 57.7 million.
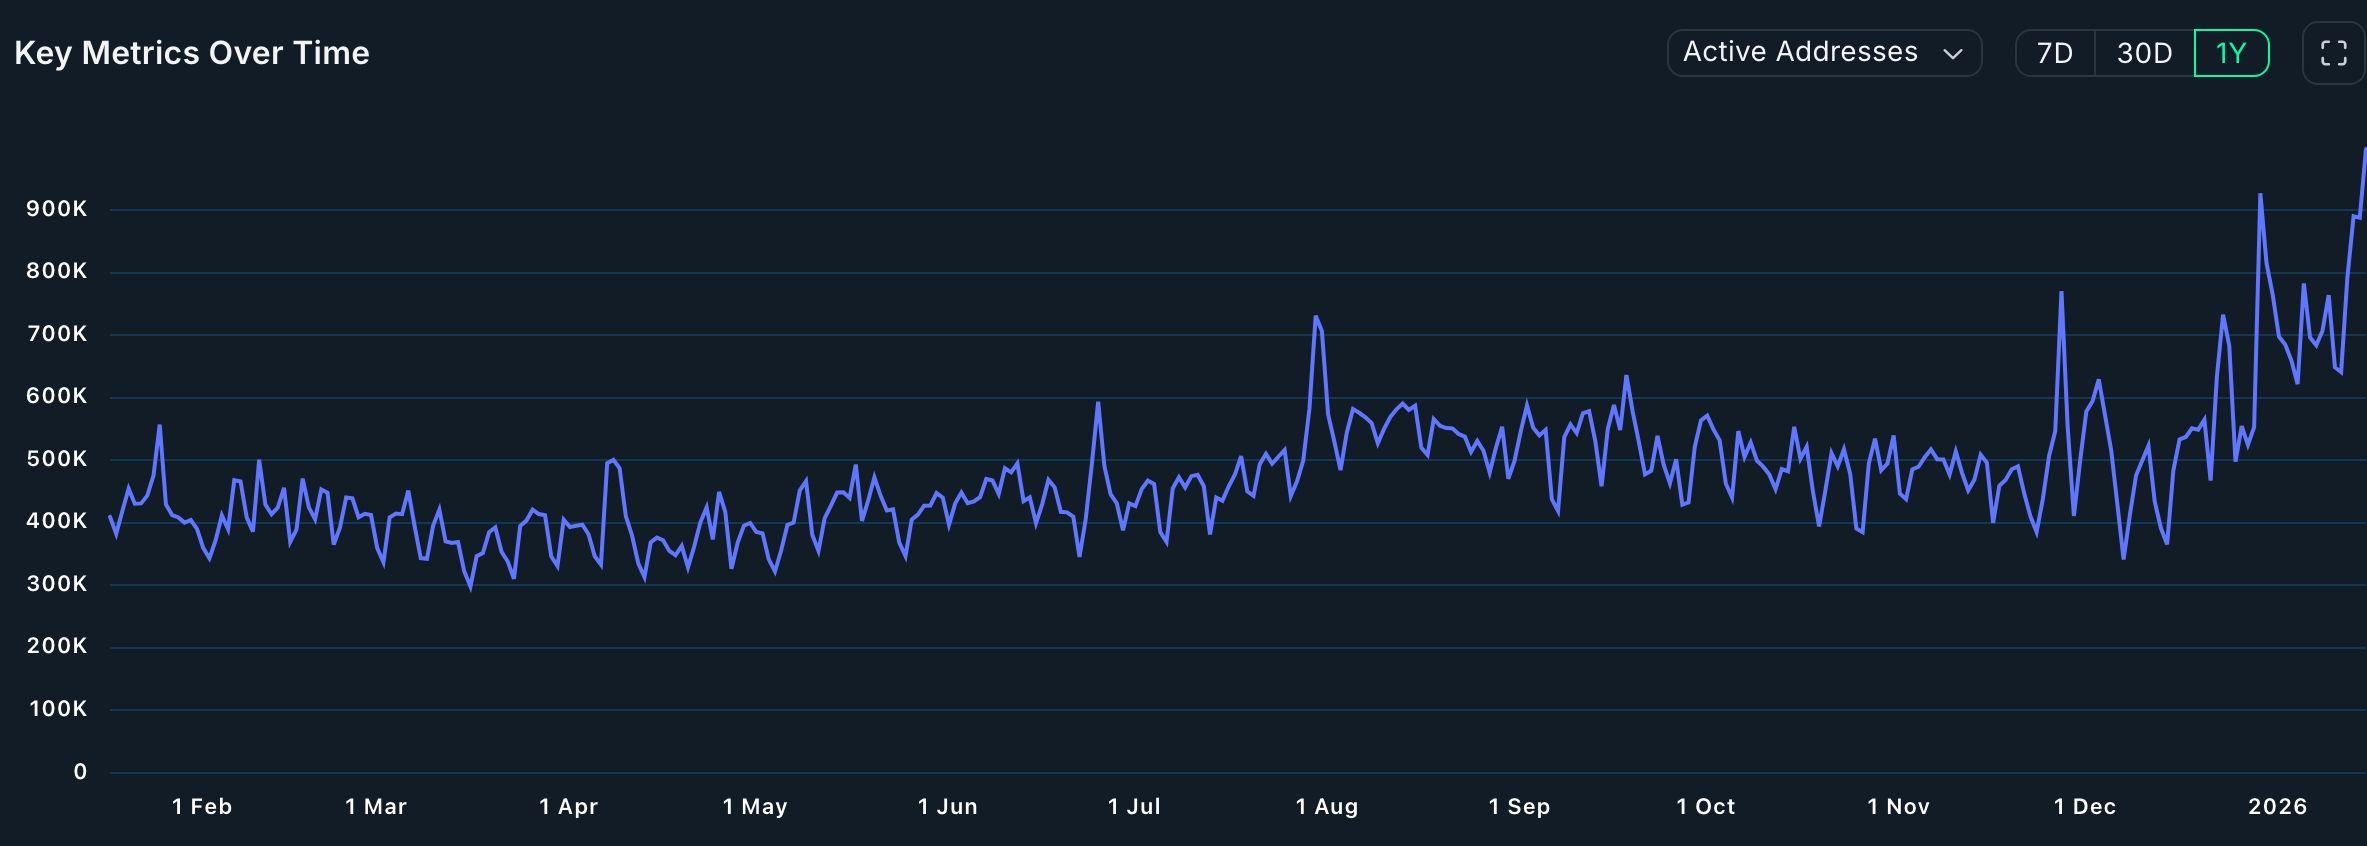
It was also the fastest-growing chain in terms of active addresses, which rose by 53% to over 13 million. Users have jumped to a record high after the Fusaka upgrade.
Meanwhile, more investors are staking their Ethereum holdings, led by Tom Lee’s BitMine. Data compiled by StakingRewards shows that the staking market capitalization has jumped to $118 bi, giving it a staking ratio of nearly 30%. Staking inflows have soared in the past few months, a trend that may continue as BitMine stakes its entire holdings.
READ MORE: Solana Price Prediction: Top Reasons SOL Will Rebound Soon
Ethereum has also become the most dominant player in the stablecoin industry, with its holdings rising to over $170 billion and its quarterly transaction volume soaring to over $8 trillion in Q4.
Its assets in the real-world asset (RWA) tokenization industry have continued to grow over the past few months, reaching $13 billion. Its holdings are much higher than those of other top chains, such as Solana and Tron.
Still, some key Ethereum metrics have deteriorated in the past few weeks. For example, its fees have dropped by 31% in the last 30 days to $10.5 million, lower than BNB Chain’s $16.5 million and Solana’s $16.9 million. This decline occurred because Ethereum’s transaction costs have dropped over the past few months, which is good for users.
Another key metric is its volume in the decentralized exchange (DEX) industry, which has been in a downward trend in the past few consecutive months. It handled $49 billion in December, down from $128 billion in August last year.
Ethereum Price Technical Analysis
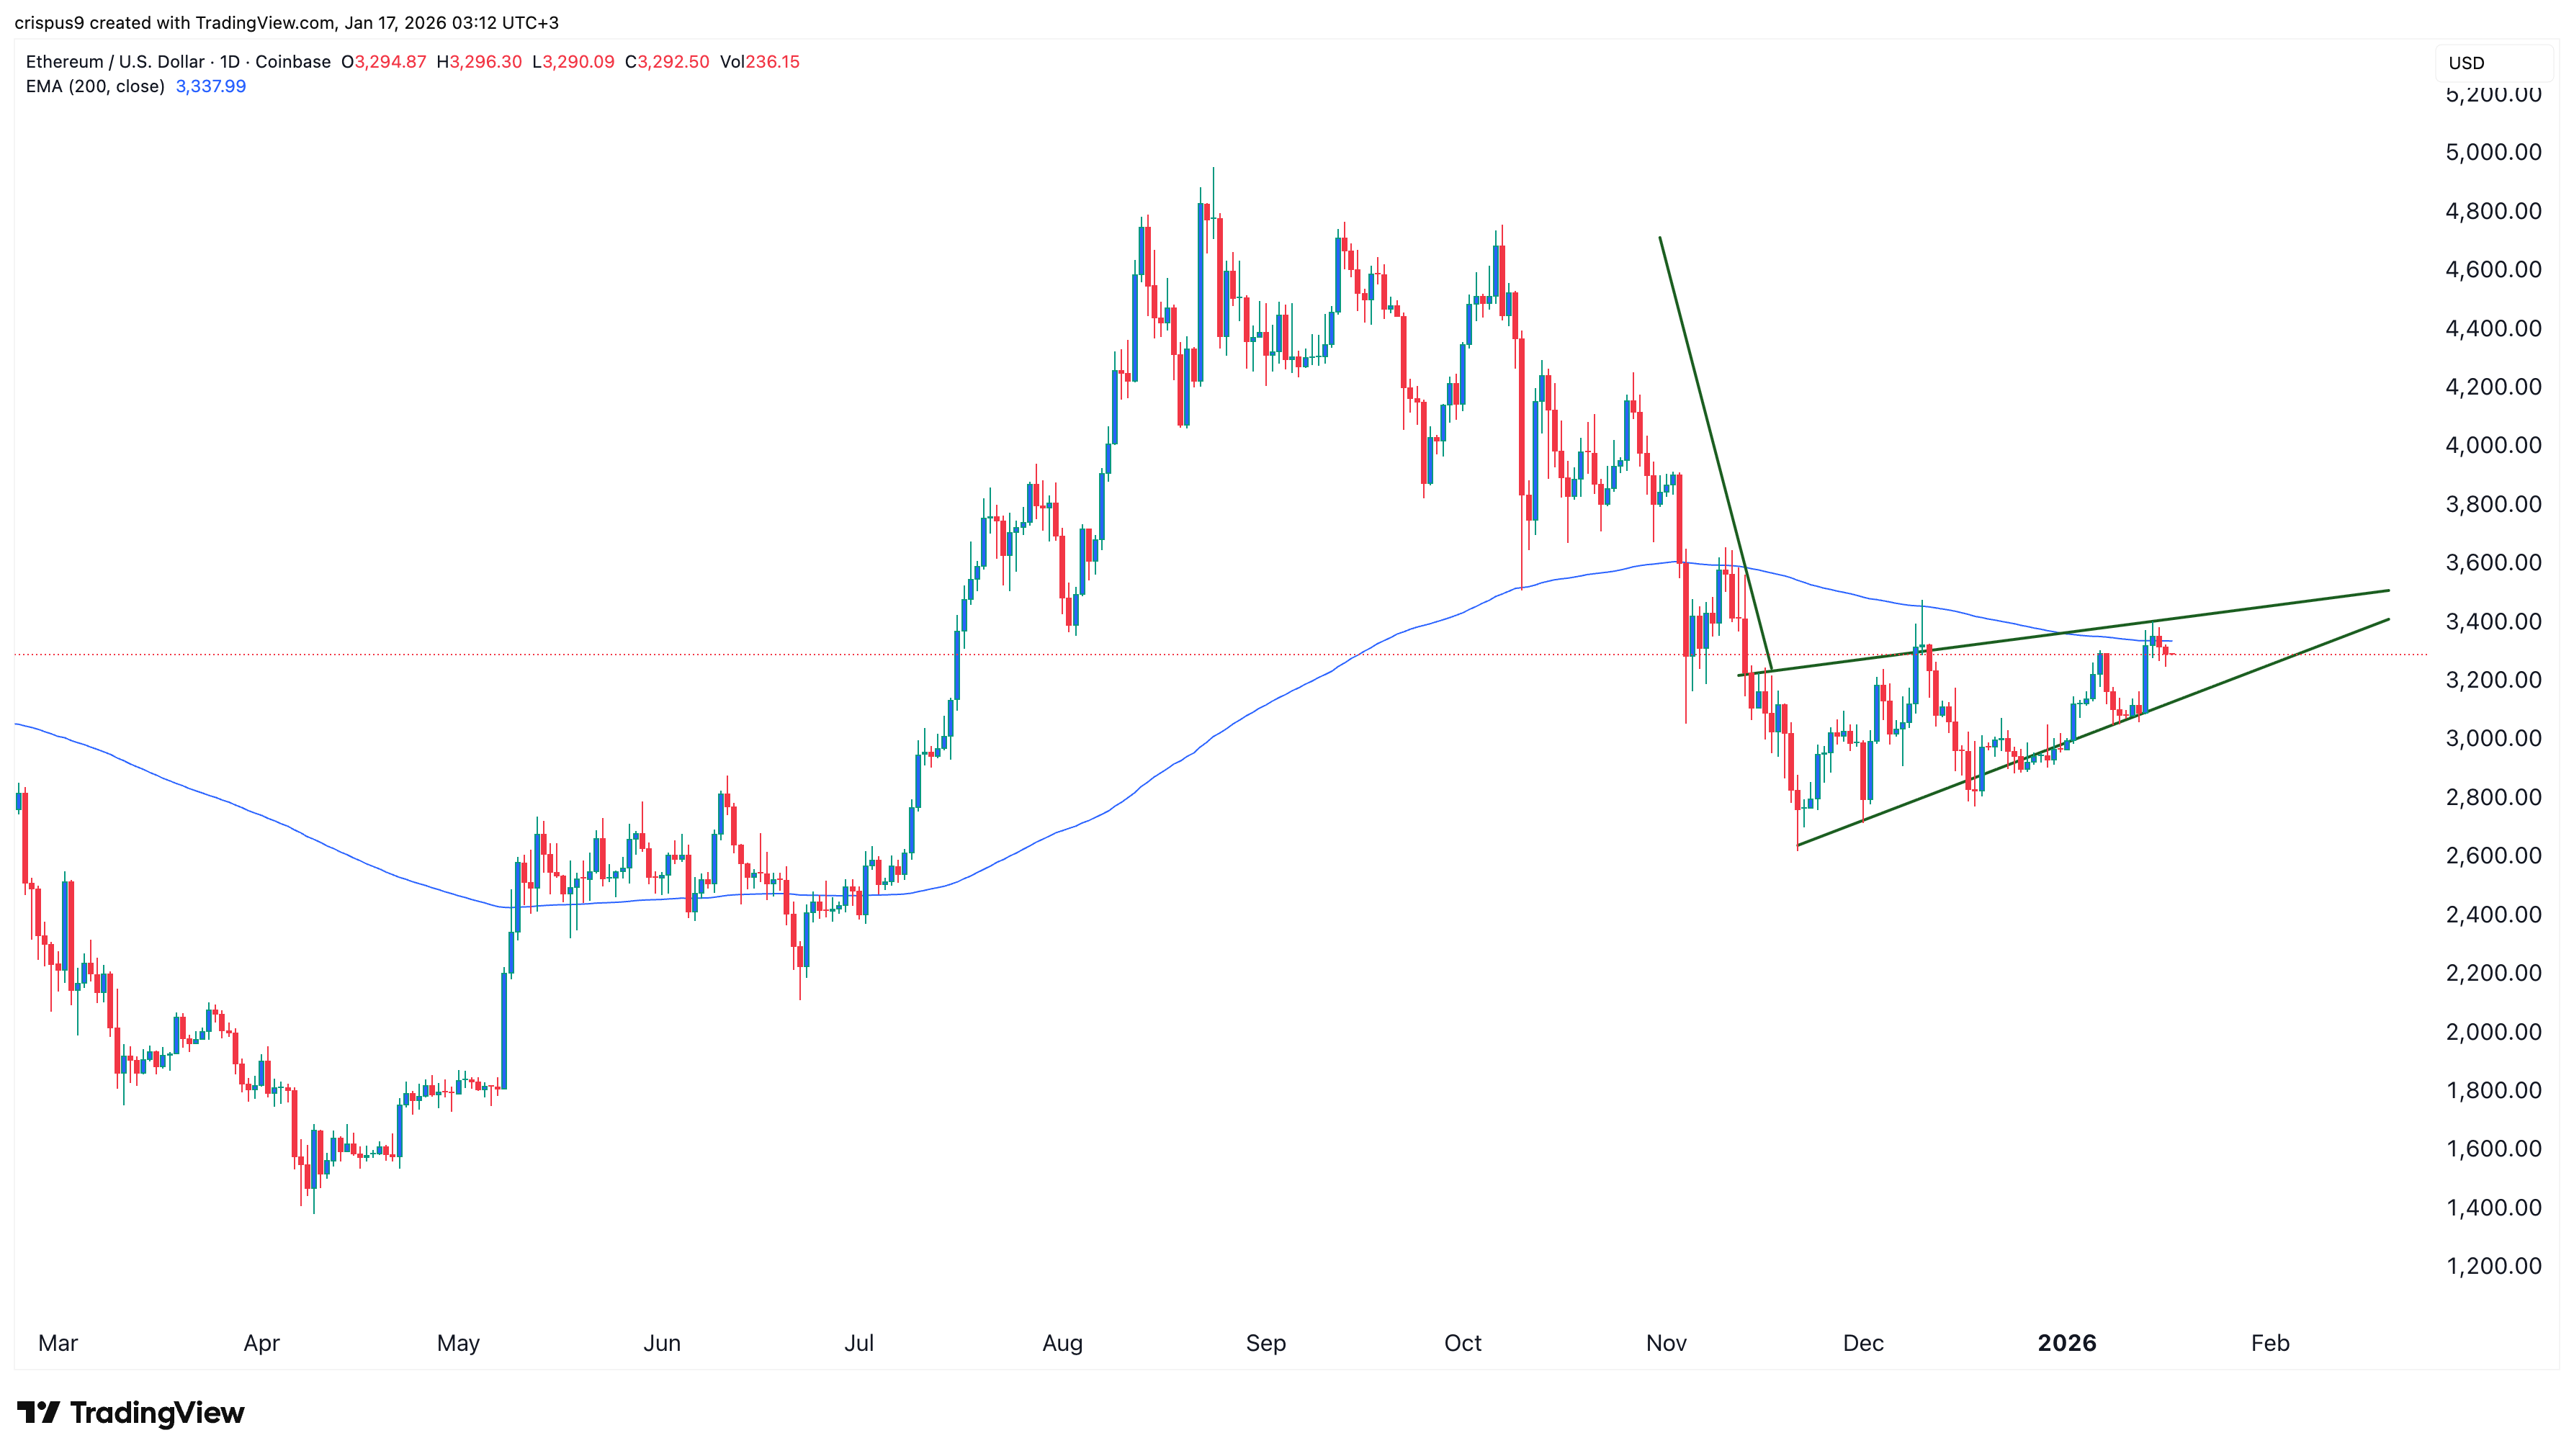
The daily timeframe chart shows that Ethereum’s price recovery stalled at the 200-day Exponential Moving Average (EMA) level. It has also formed a rising wedge pattern, a common bearish reversal pattern composed of two converging trendlines.
The rising wedge pattern is forming after the token dropped sharply from its 2025 high. As such, it could be part of a bearish pennant chart pattern.
Therefore, the most likely scenario is a big bearish breakdown in the next few days, potentially to the November low at $2,625. This target is about 20% below the current level.
READ MORE: Pi Network Price Prediction: Here’s Why Pi Coin is Struggling in 2026