


ICP price has pulled back sharply in the past few days, moving from the year-to-date high of $4.8 on January 15 to the current $3.60. It has dropped for 8 consecutive days and is trading at its lowest level since January 13.
ICP Burn Rate Rising Amid Increased Caffeine Usage
The Internet Computer token has pulled back in the past few days, erasing most of the gains made earlier this month.
This crash has coincided with the retreat of other tokens like Bitcoin, Ethereum, Solana, and BNB Coin.
The ICP token has plunged even as the network’s token burn continued to rise. Data shows that it incinerated over 20,552 coins on January 21, the biggest daily increase in months. Token burns are usually bullish as they reduce the number of tokens in circulation.
The token burn could continue rising after the developers announced Mission 70, which targets a 70% reduction in inflation by the end of this year. It will achieve this by cutting the new ICP tokens minted and by burning coins.
READ MORE: Pi Network Price Forms Bullish Patterns After Hitting All-Time Low
Meanwhile, the number of Caffeine users has continued to rise this year, which explains why ICP has become one of the most active tokens based on GitHub activity.
Data shows that over 3.8 million users have spent more than 500k hours on Caffeine. Caffeine is redefining how users build websites using artificial intelligence (AI). It aims to disrupt popular platforms like Wix and Squarespace.
More data shows that the long/short ratio on Binance has continued rising this year. It moved to 1.97, its highest level since November 9, up from 0.9 in December. A rising ratio means that more users are holding long positions.
ICP Price Technical Analysis
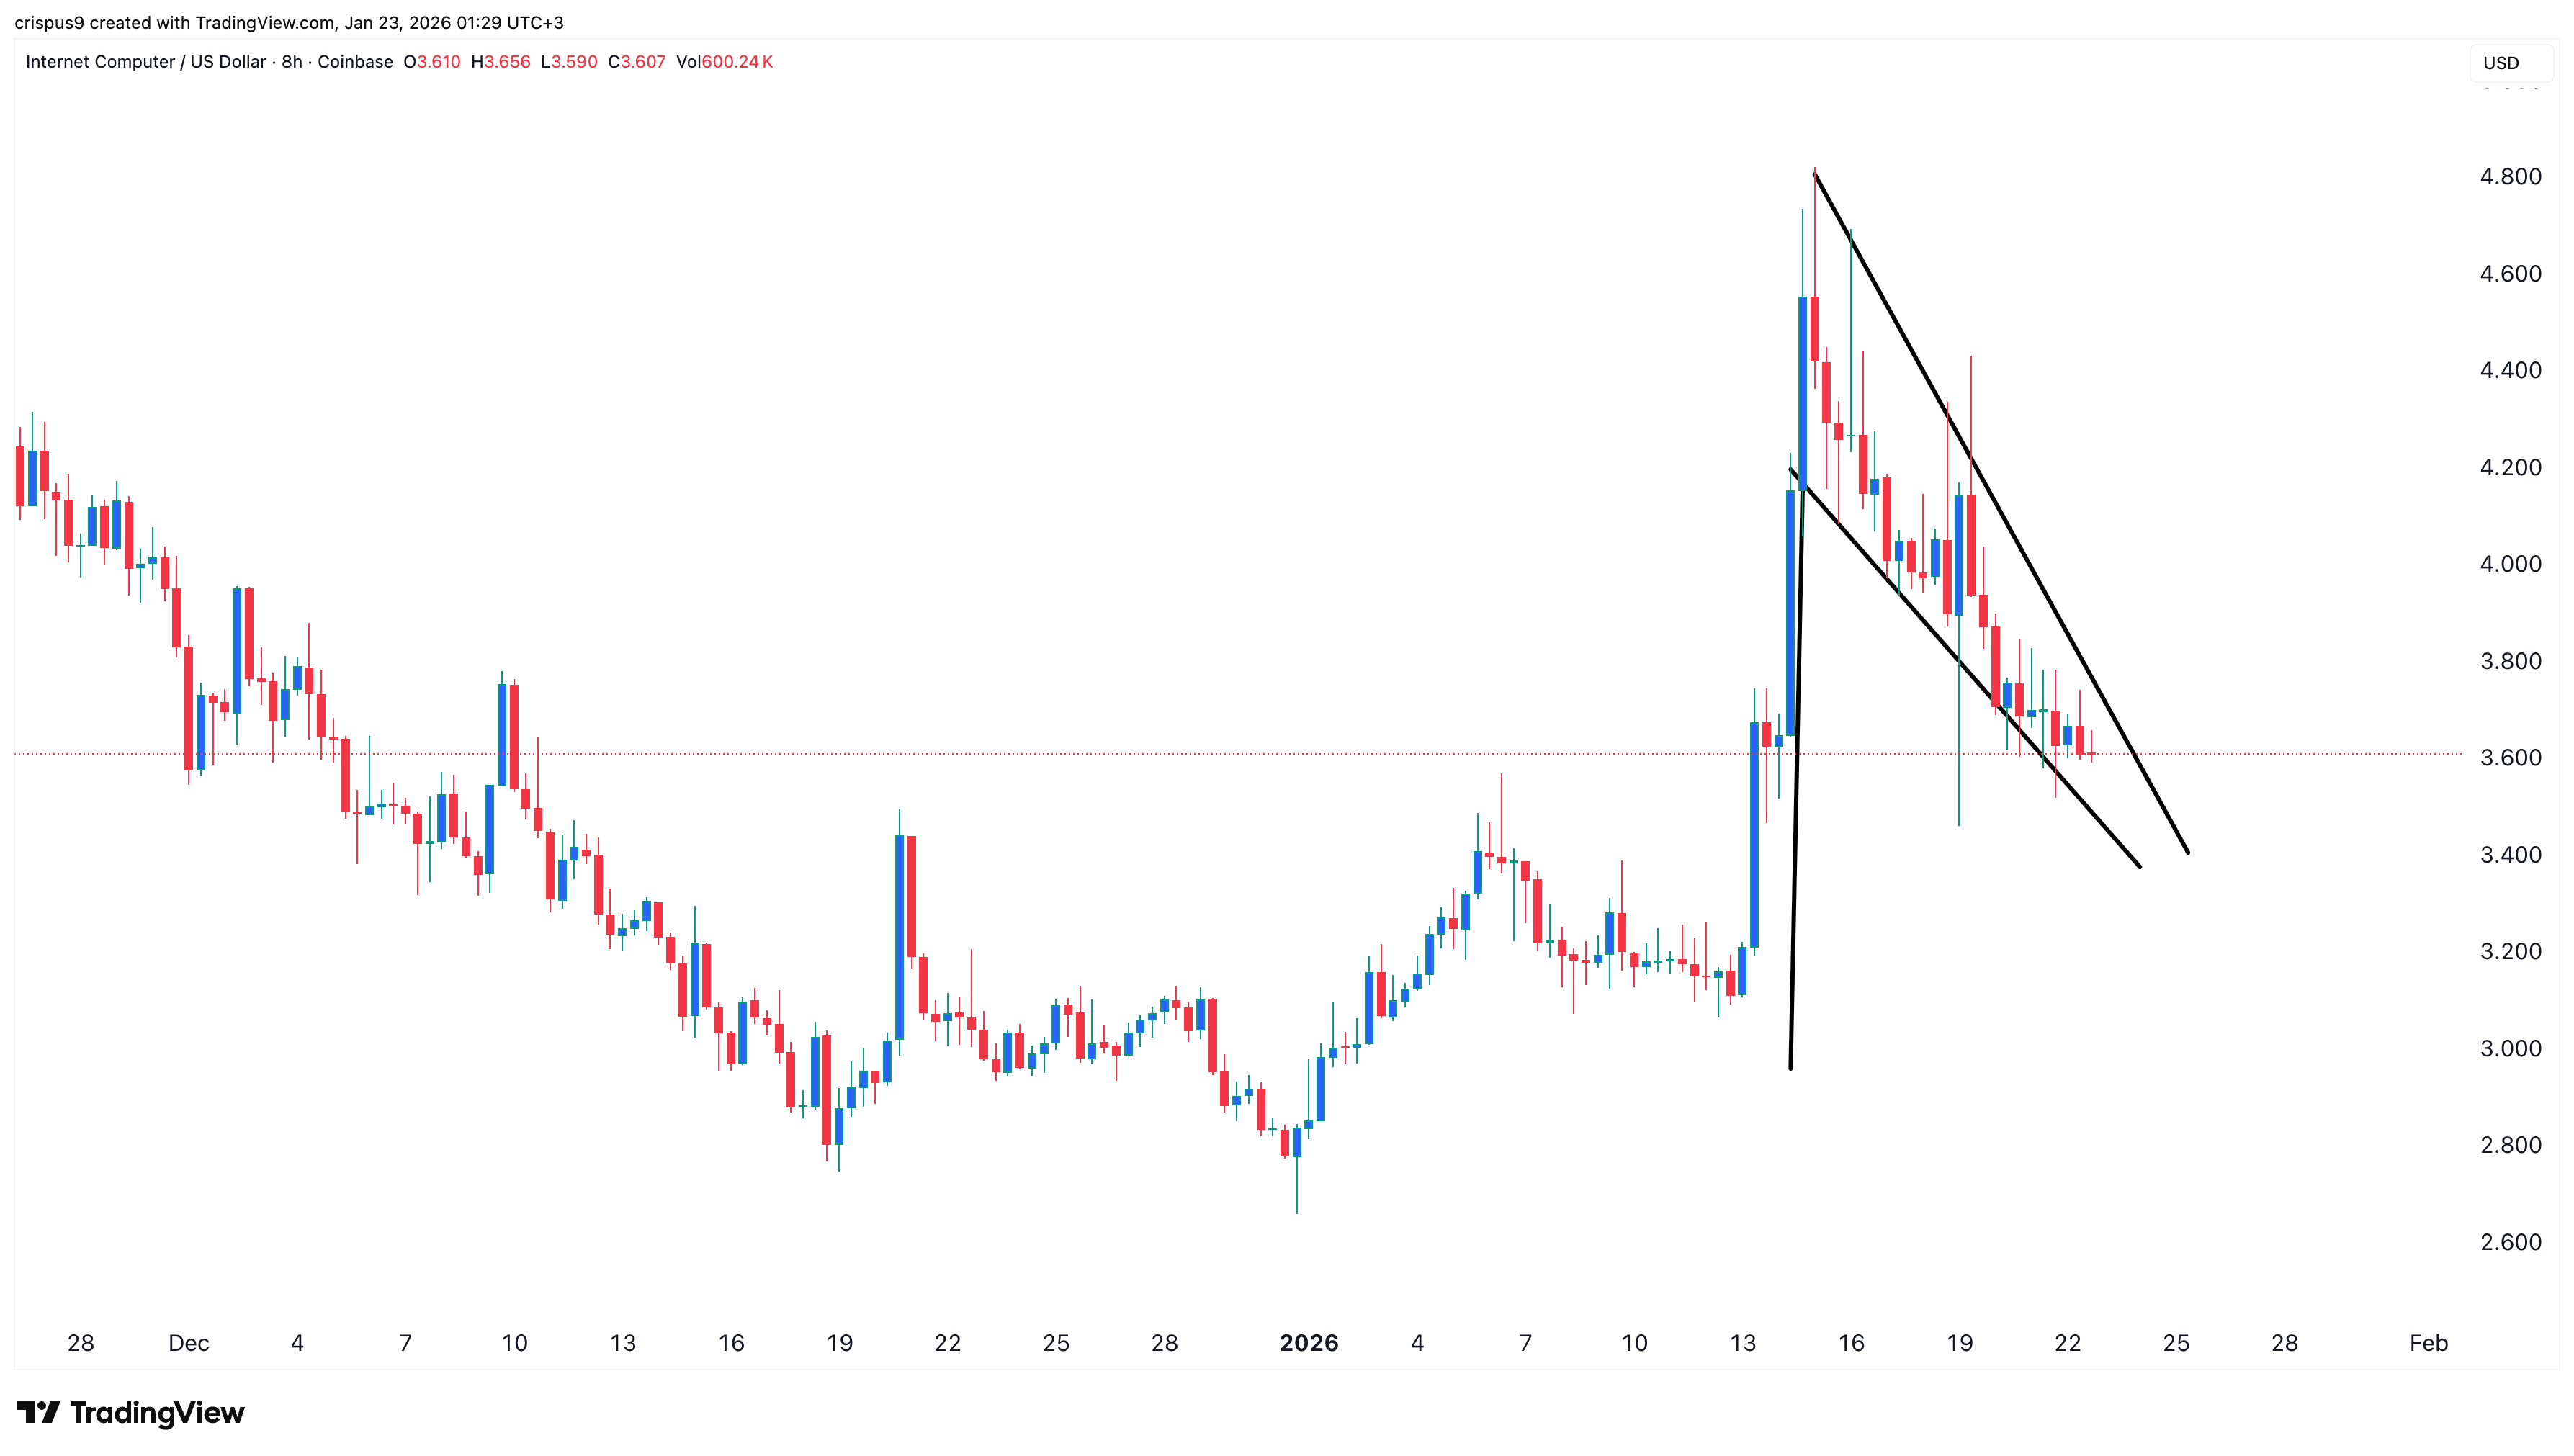
The eight-hour chart shows that the ICP token price has crashed from its year-to-date high of $4.8 to $3.6. A closer look shows that the token has formed a falling wedge pattern, consisting of two converging trendlines. It is one of the most common bullish reversal signs in technical analysis.
The wedge is forming after the token surged, indicating it is part of the bullish pennant pattern. Therefore, the most likely scenario is where it rebounds in the coming weeks or days, potentially to the year-to-date high of $4.8, which is about 35% above the current level.
READ MORE: PayPal Stock Charts Bearish Pattern Before Earnings Report