


The iShares Silver ETF (SLV) continued its strong surge this week, hitting its all-time high as the silver price surged to a record high ahead of the upcoming Federal Reserve interest rate decision and as the odds of a US government shutdown rose. SLV ETF jumped to a high of $106, up by 250% in the last 12 months. Still, there is a risk that the fund and silver prices will have a pullback in the near term.
Why the Silver Price is in a Bull Run
Silver price continued its remarkable bull run as it mirrored the performance of gold, which has jumped to a record high of over $5,000 as geopolitical jitters rose. For example, Donald Trump has sent an armada into the Middle East and there is a possibility that he will attack Iran soon. In an interview with Axios, he said that he was still undecided, but was actively considering how to respond to the recent Iranian protests.
Iran, on the other hand, has warned that any attack will lead to a major retaliation that will impact the energy market this year. Odds of an attack happening this year have continued rising this year.
READ MORE: Tesla Stock Price Forecast: Mixed Patterns Emerge Ahead of Earnings
Gold and silver prices jumped as investors reacted to the rising odds that the US will go through another prolonged government shutdown on Monday. Democrats have threatened to shut it because of the ongoing brutality by ICE and the Department of Homeland Security. It will be the second government shutdown in a few months.
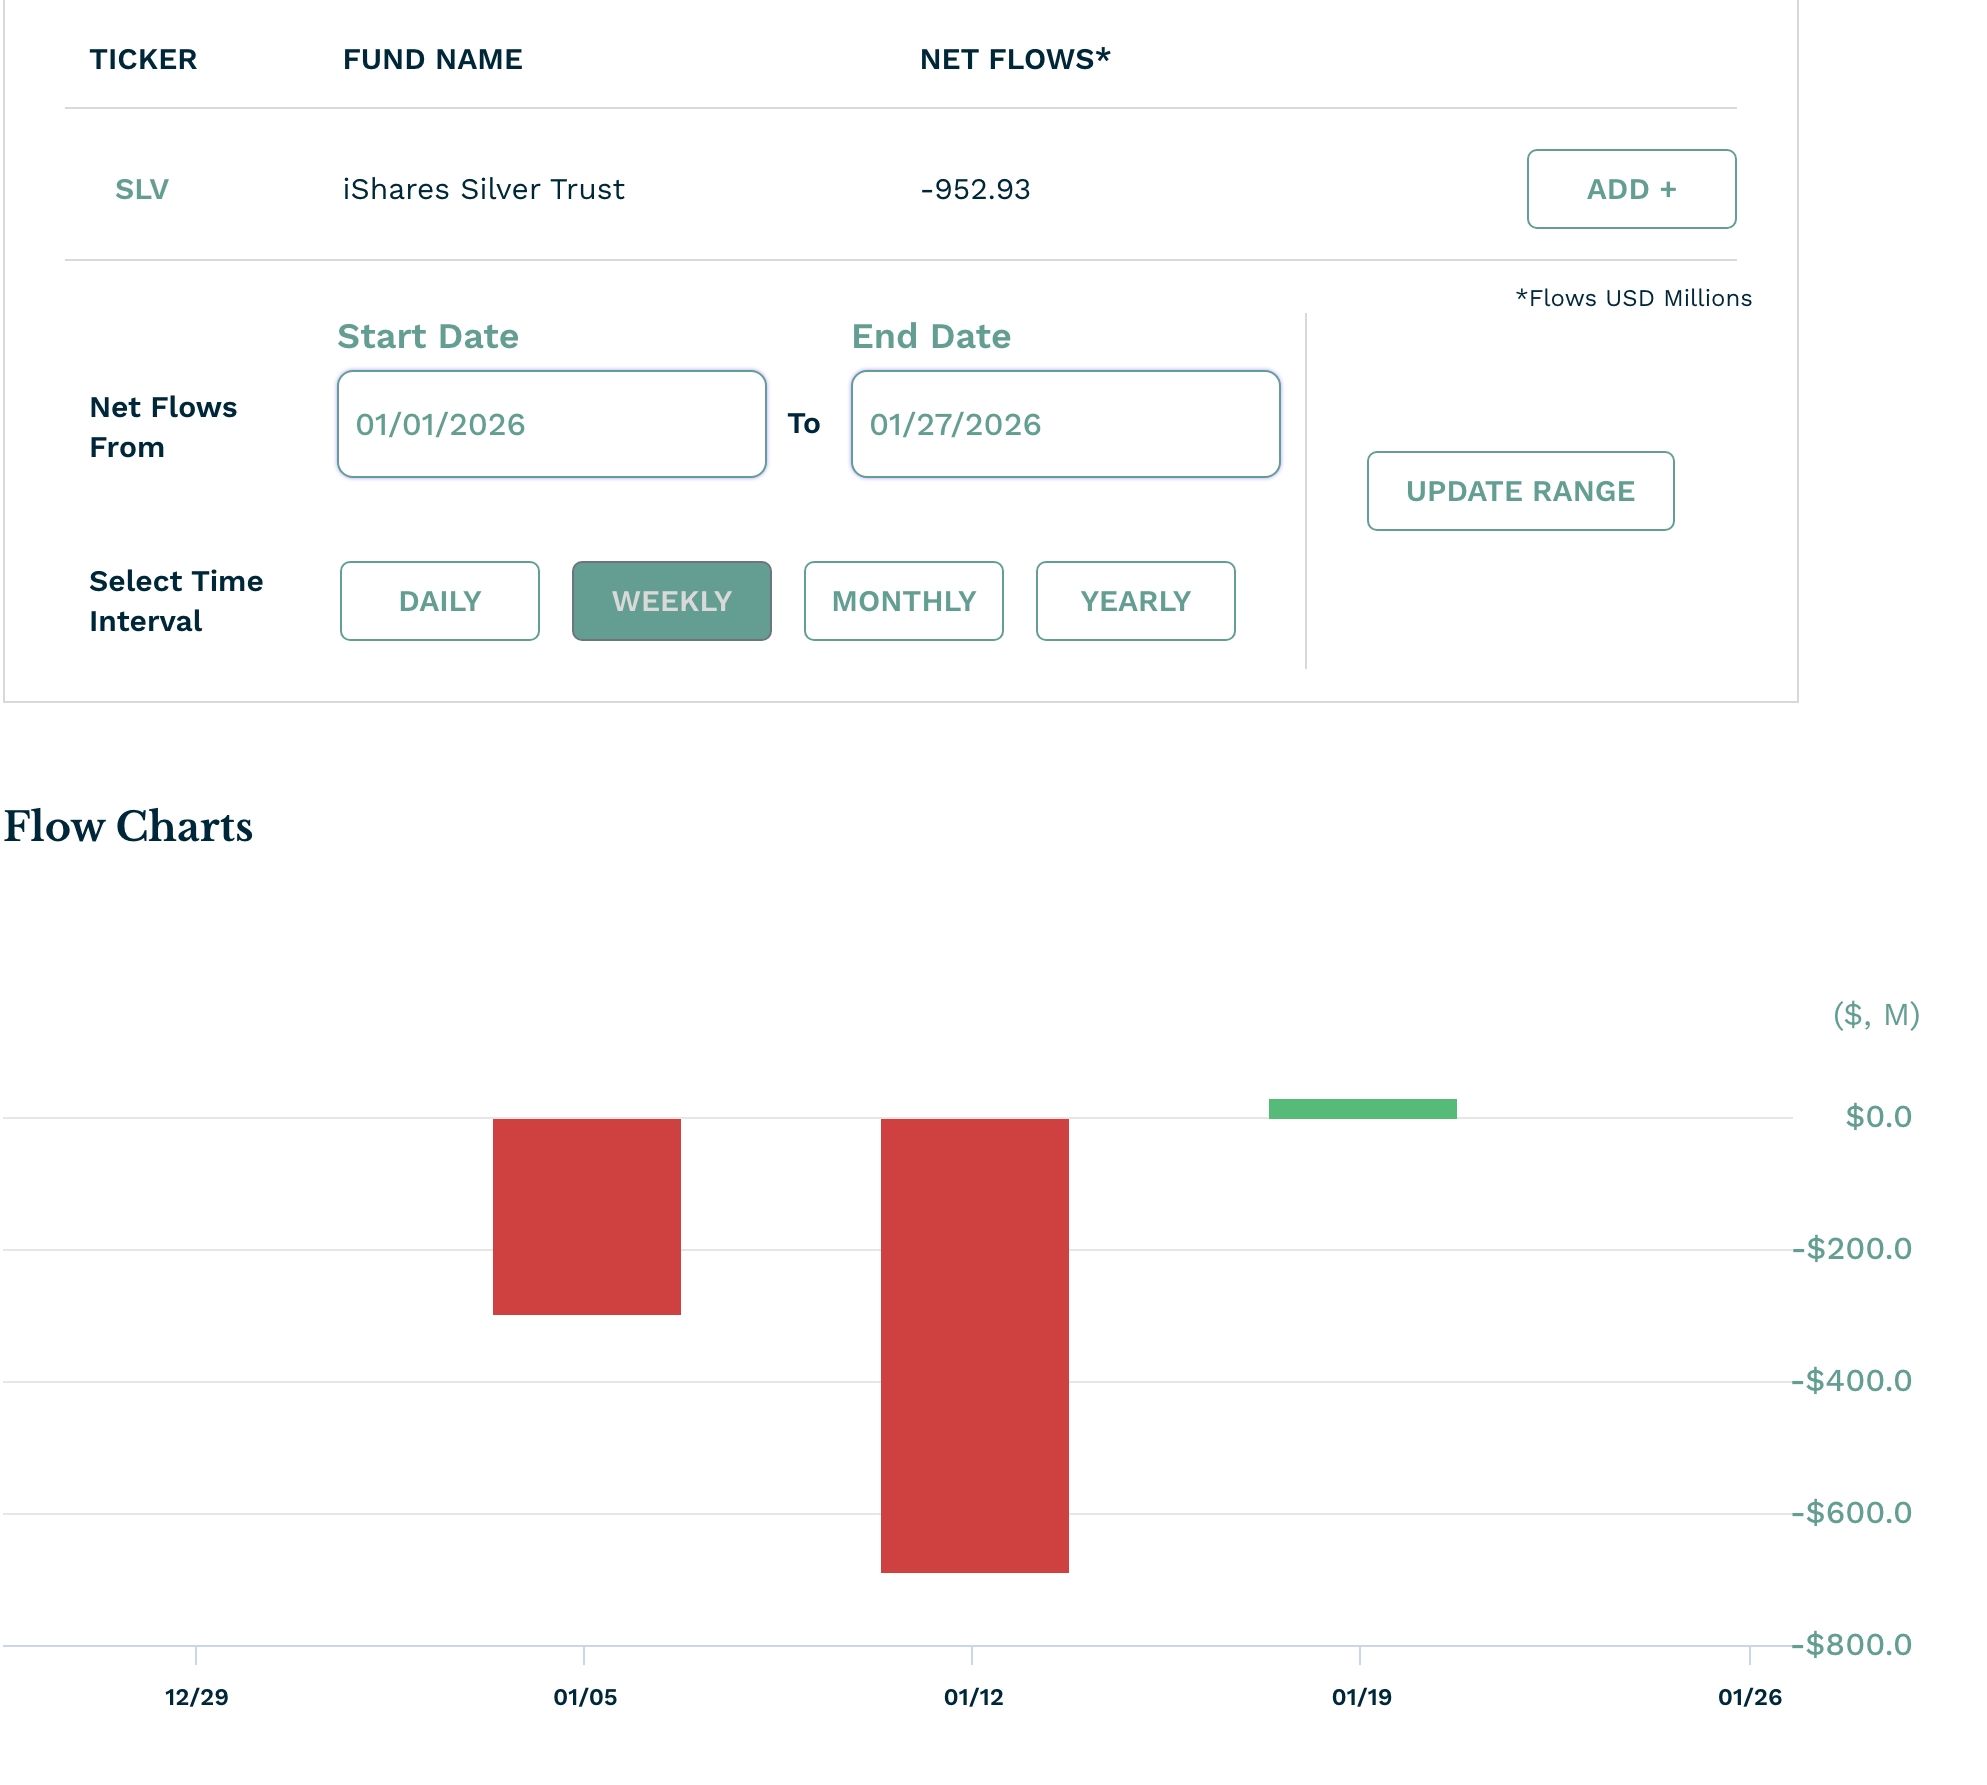
Still, there is a risk that silver and the SLV ETF will have a reversal in the coming weeks or months. First, data shows that smart money investors have started to rotate out of the SLV ETF despite the ongoing rally. The fund has experienced an outflow of over $952 million this year. In most cases, you would expect the fund to have inflows as the price surges.
SLV ETF Stock Price Technical Analysis
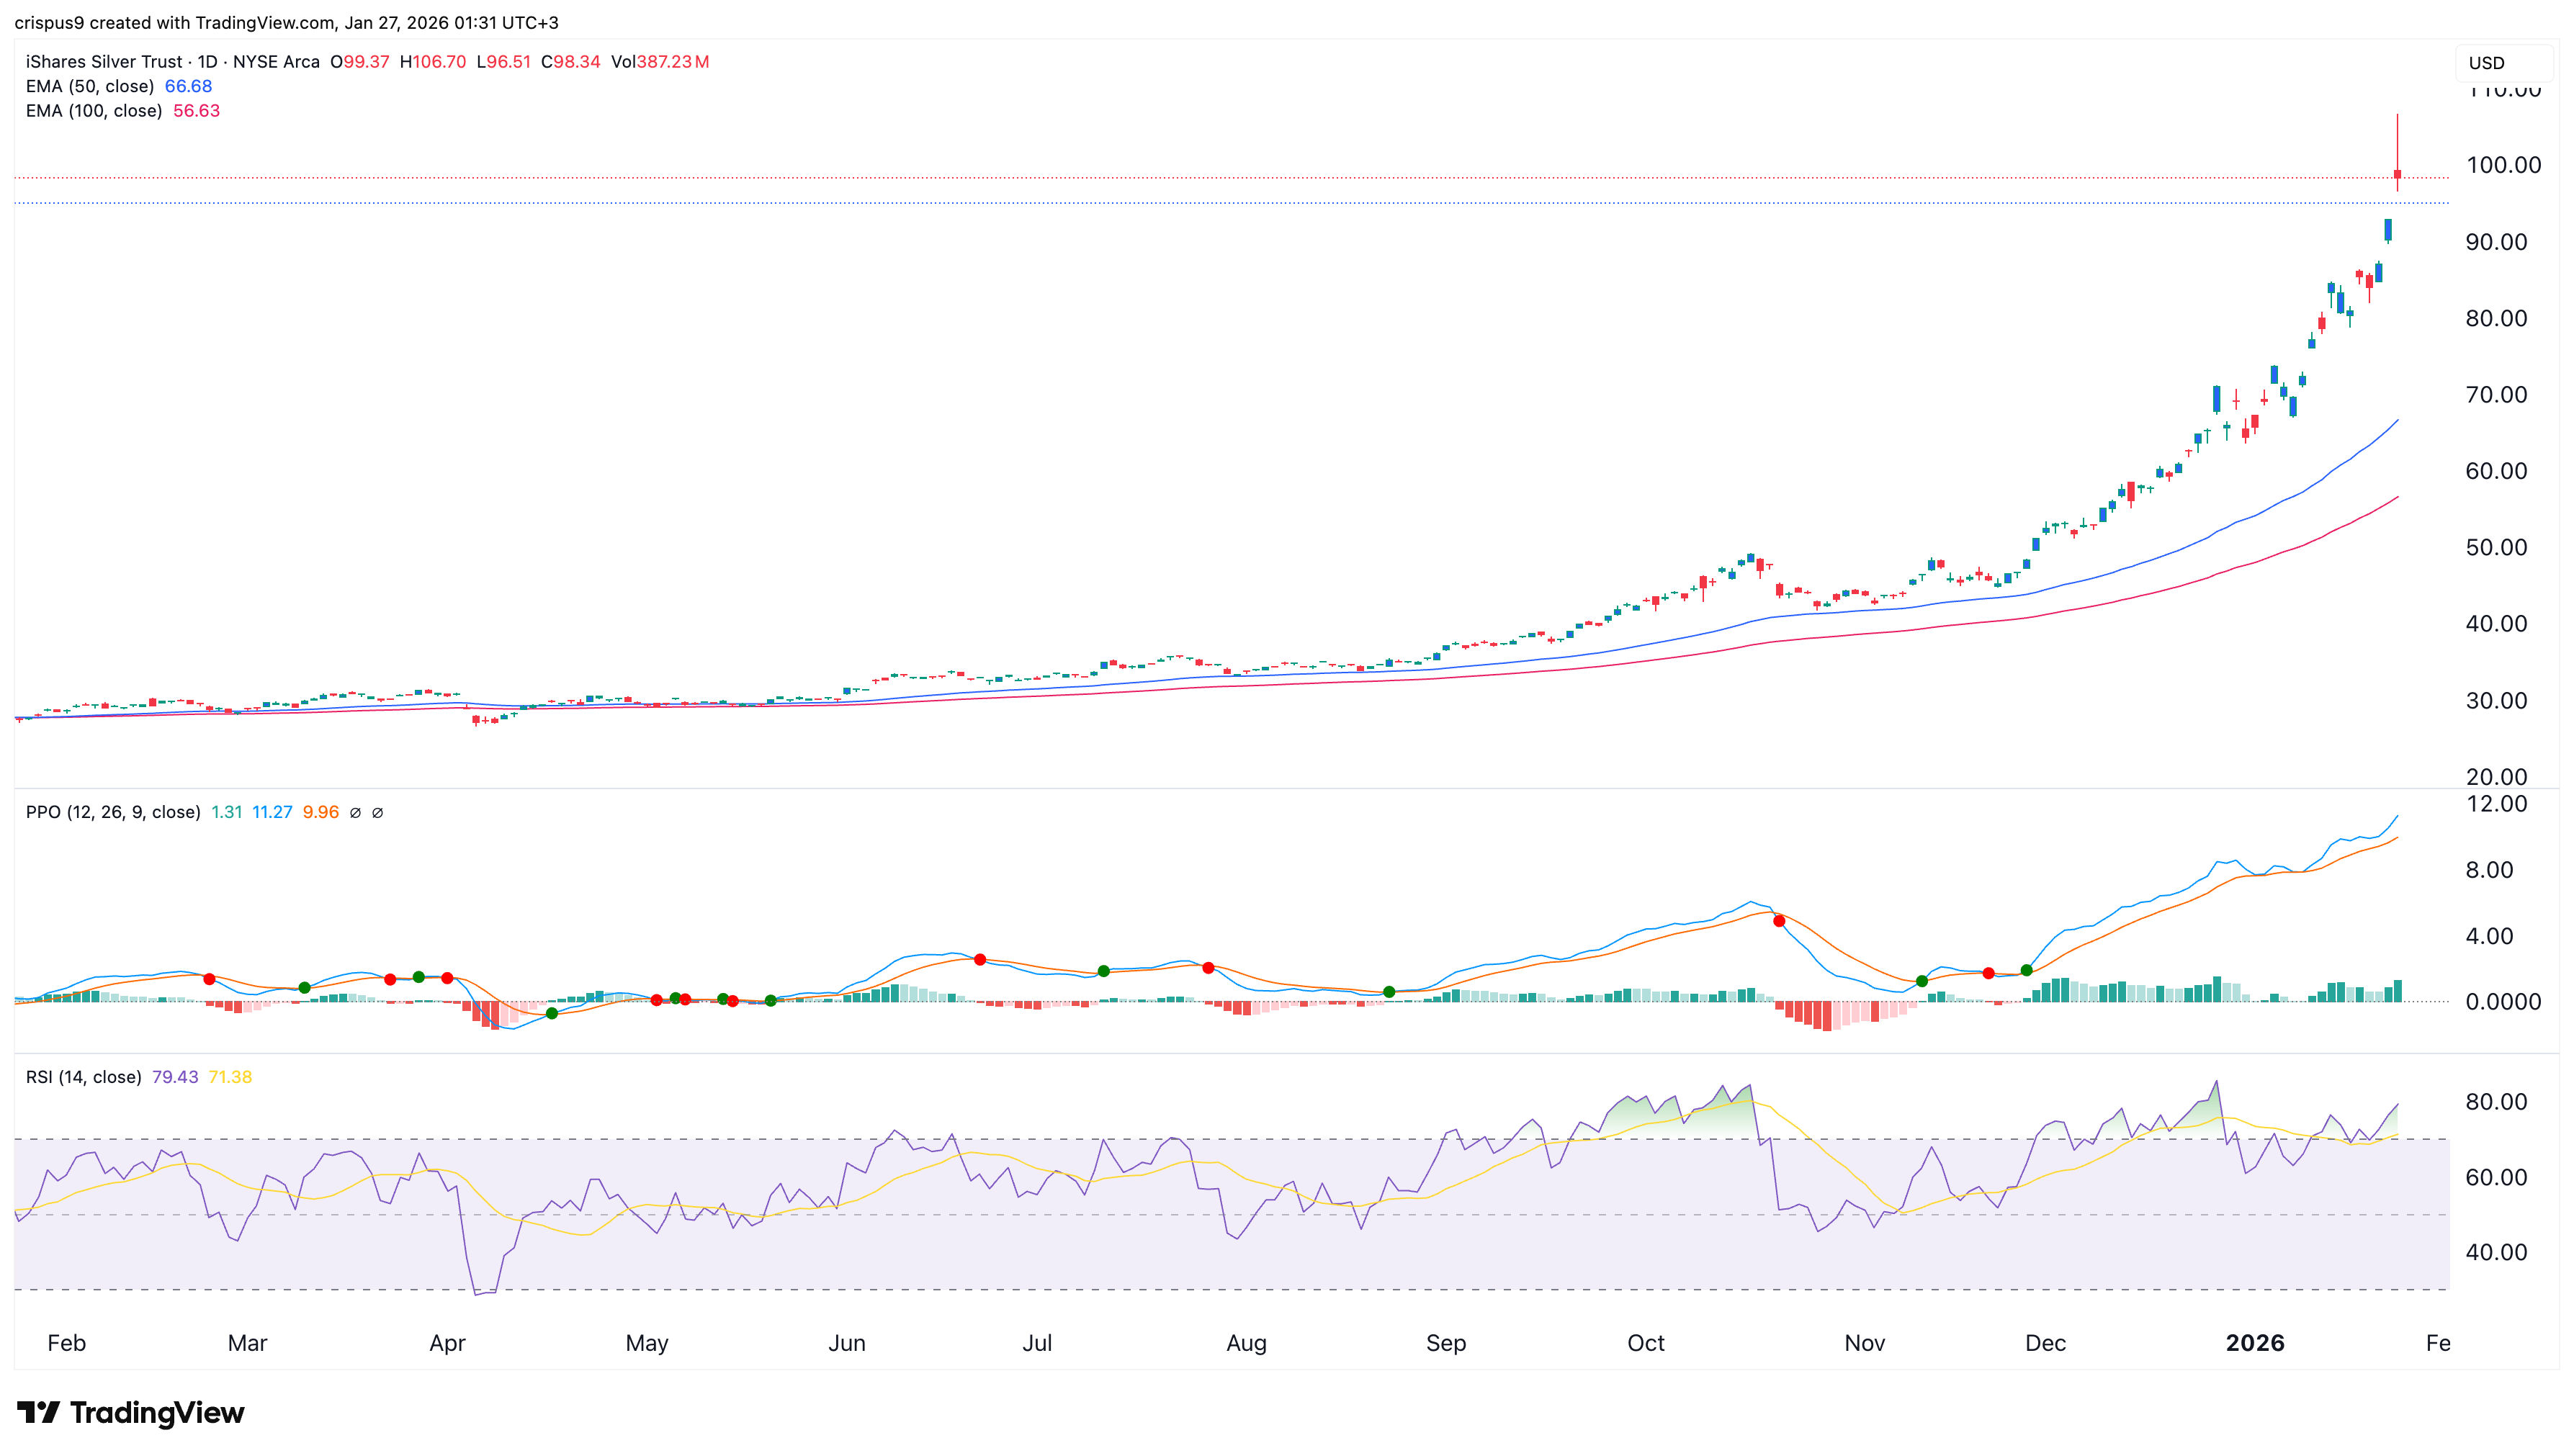
The daily timeframe chart explains why the SLV ETF stock may be on the verge of a strong bearish breakdown in the near term. It has formed a shooting star candlestick, which is made up of a long upper shadow and a small body. This is one of the most common bearish reversal chart patterns in technical analysis.
The ETF remains much higher than the 50-day and 100-day Exponential Moving Averages (EMA), meaning that it may go through a mean reversion in the near term. Also, the Relative Strength Index (RSI) and the Percentage Price Oscillator (PPO) have moved to extreme levels, meaning that a reversal could be on the way. If this happens, the next key support level to watch will be at $90.
READ MORE: SoFi Stock Price Forms Scary Patterns Ahead of Earnings: Will it Crash?