


Ethereum price continued its freefall this week, and is now hovering near its lowest level since July last year. It has slipped by 47% from its all-time high despite improving network metrics. This article explains why the token has crashed despite its network growth and what to expect.
Ethereum Network is Firing on All Cylinders
A closer look at key third-party data shows that Ethereum network is firing on all cylinders, a trend that will accelerate after the upcoming Glamsterdam and Hegota upgrades.
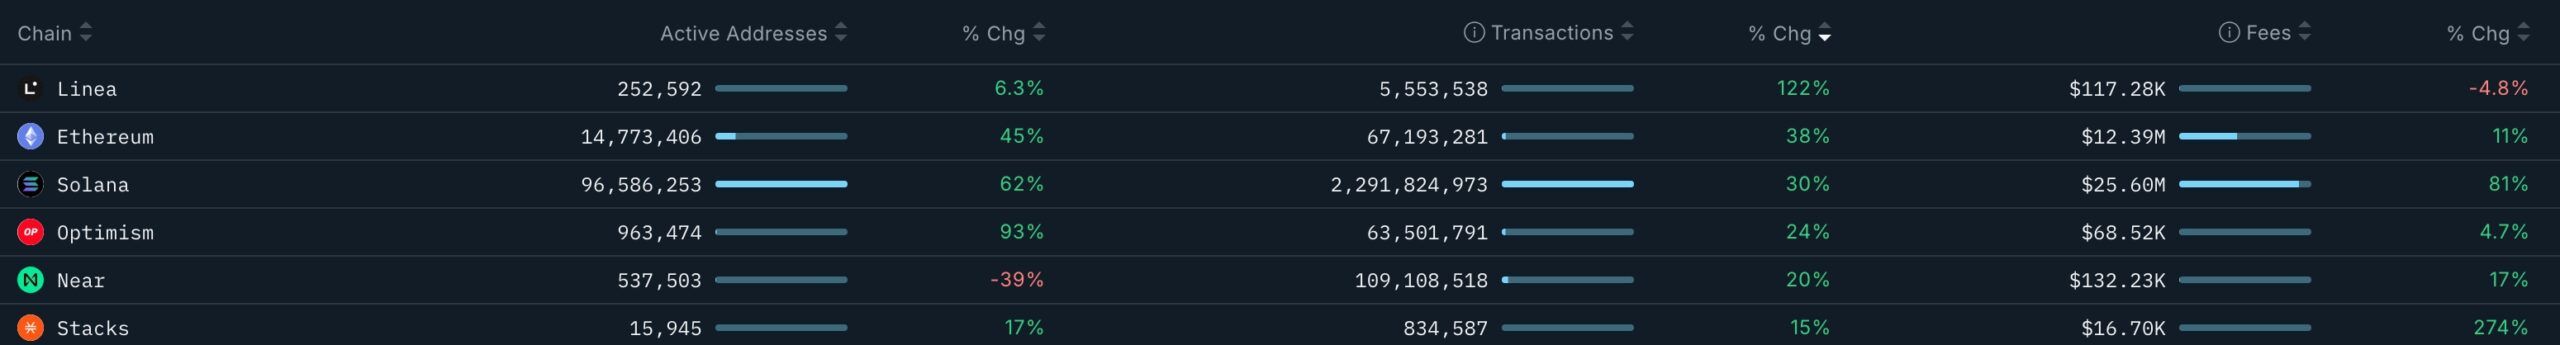
Data compiled by Nansen shows that the network handled over 67 million transactions in the last 30 days, up by 38%. At the same time, the number of active users jumped by 45% to 14.7 million, while network fees rose by 11% to over $12.39 million.
Ethereum’s growth is mostly because of its stablecoin business, which has benefited from its relatively low fees. Data shows that Ethereum fees have dropped sharply in the past few months and is almost cheaper than some layer-2 networks.
Recent data showed that Ethereum network handled over $8 trillion in stablecoin transfers in the fourth quarter. According to Artemis, it has handled over $1 trillion in volume in the last 30 days, with the number of stablecoin addresses soaring to over 7.2 trillion.
Stablecoin transactions and volume will continue accelerating in the coming years. Analysts believe that the supply of stablecoins will jump from over $300 billion today to over $1 trillion in the next few years.
Ethereum is also the most dominant chain in the decentralized finance (DeFi) and real-world asset (RWA) tokenization jumped. While the number of competitors like Solana and Aptos have come up, data shows that its dominance has accelerated in the past few months.
Therefore, Ethereum price has crashed because of the broader crypto market crash that has affected Bitcoin and most altcoins. It also happened as ETH ETF outflows accelerated in the past few weeks.
Technicals Also Explain the Ethereum Price Crash
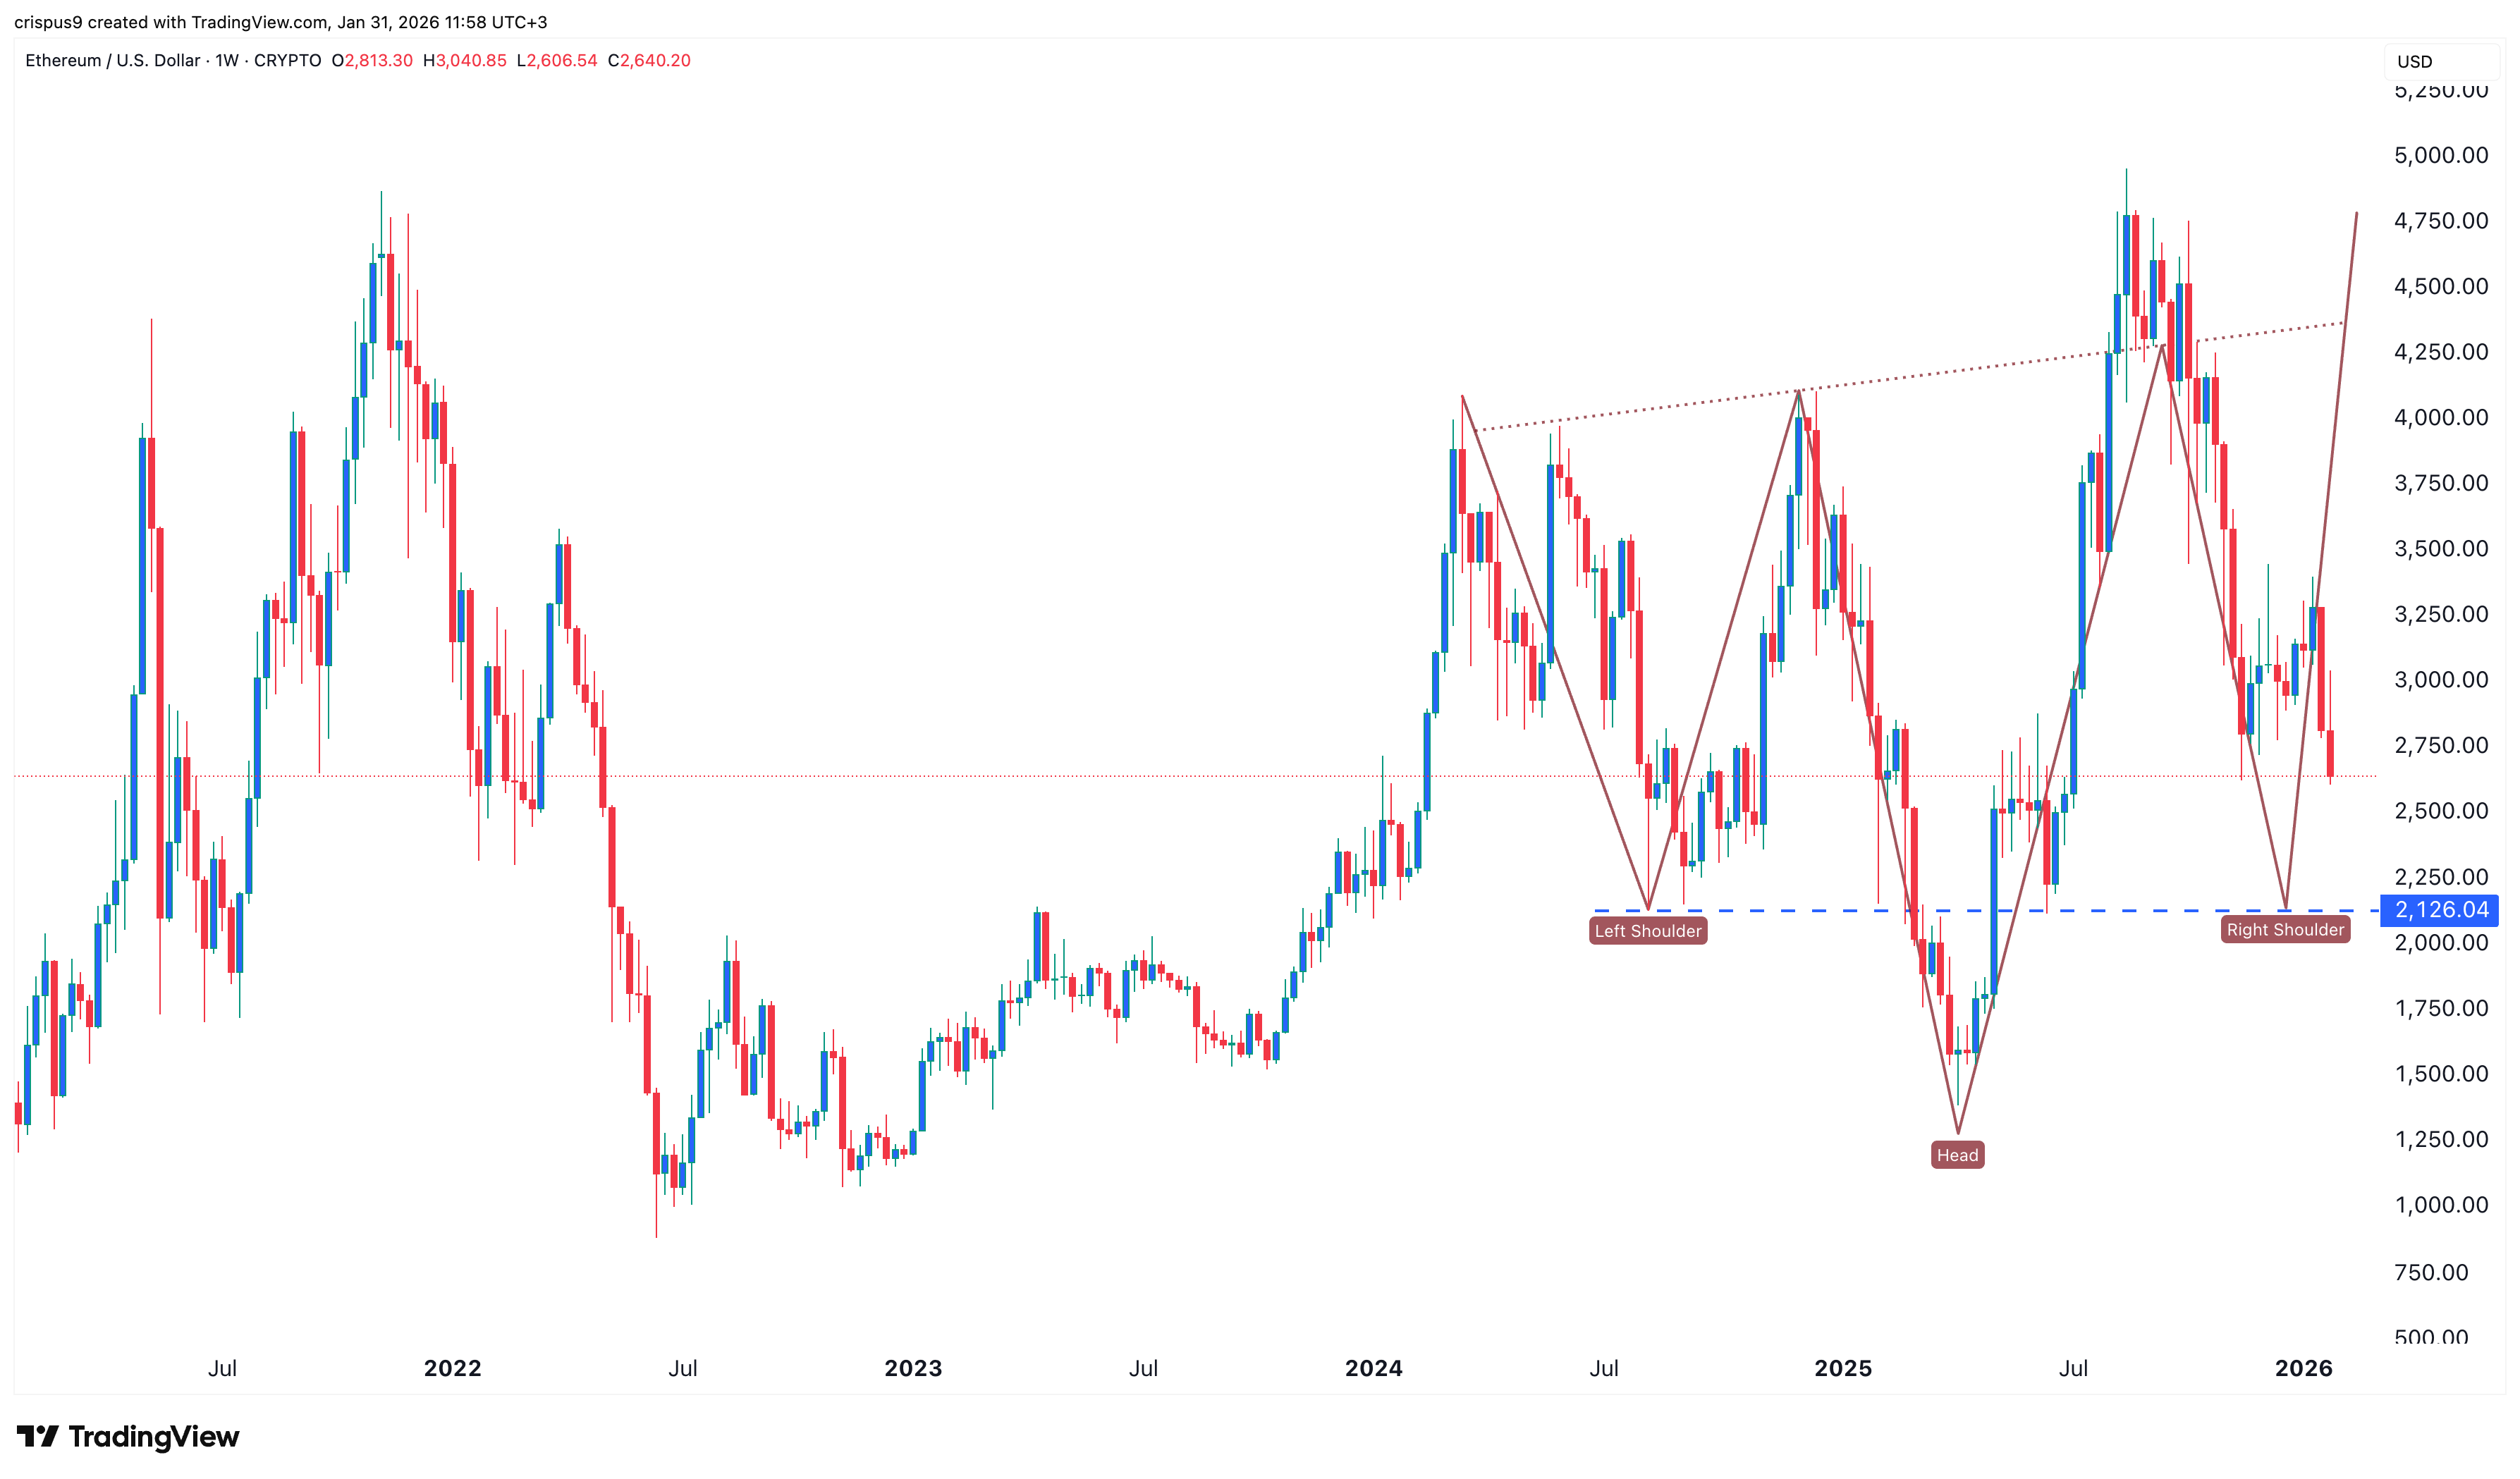
The weekly chart also explains why the ETH price has crashed in the past few months. This chart shows that the coin is in the process of forming an inverse head-and-shoulders pattern, a common bullish reversal sign. It has completed the formation of the head and the left shoulder. It also recently formed a bearish flag pattern.
Therefore, the ongoing Ethereum price crash is happening as the token targets the left shoulder section at $2,125. As such, it may drop towards that level in the coming weeks and then stage a strong rebound. However, a drop below $2,125 will invalidate the bearish outlook.
READ MORE: Bitcoin Price Prediction: BTC Risks Drop Toward $70K