


XRP price retreated on Saturday as Friday’s rebound faded amid a dead-cat bounce fears. Ripple token was trading at $1.40, down from the Friday high of $1.5485. It remains much higher than this week’s low of $1.1180.
Ripple Token Losses Momentum Despite Rising XRP ETF Inflows
XRP price rebound on Friday coincided with the broader crypto market rally, which pushed Bitcoin and most altcoins higher after suffering a major crash. The rally happened as investors bought the dip during bargain hunting.
This rebound also coincided with the substantial decline of the VIX Index and the rebound of American equities, with the Dow Jones Index crossing the important resistance level at $50,000 for the first time ever.
Traders also bought XRP ETFs, with the inflows rising by over $15 million on Friday. The funds added over $39 million in assets this week, reversing the losses experienced in the previous two weeks. Spot Bitcoin ETFs, on the other hand, shed over $689 million in assets this week, while Ethereum shed $149 million.
READ MORE: Will Strategy Go Bankrupt as MSTR Stock and Bitcoin Prices Crash?
XRP has some solid fundamentals, including the upcoming implementation of permissioned DEX tools on the network. Its permissioned DEX features will have a wide use case, including stablecoin and fiat swaps, contractor payouts, cross-border business-to-business payments, and corporate treasuries.
XRP will have a role in this product since it will be used as an auto-bridge asset in FX and remittance transactions. It will also introduce native on-ledger credit markets through the Lending Protocol. This role will lead to a higher XRP burn rate.
Still, the main risk that the XRP price is that Friday’s rally was a dead-cat bounce, a situation where an asset in a freefall rebounds briefly and then resumes the downtrend.
XRP Price Prediction: Technical Analysis
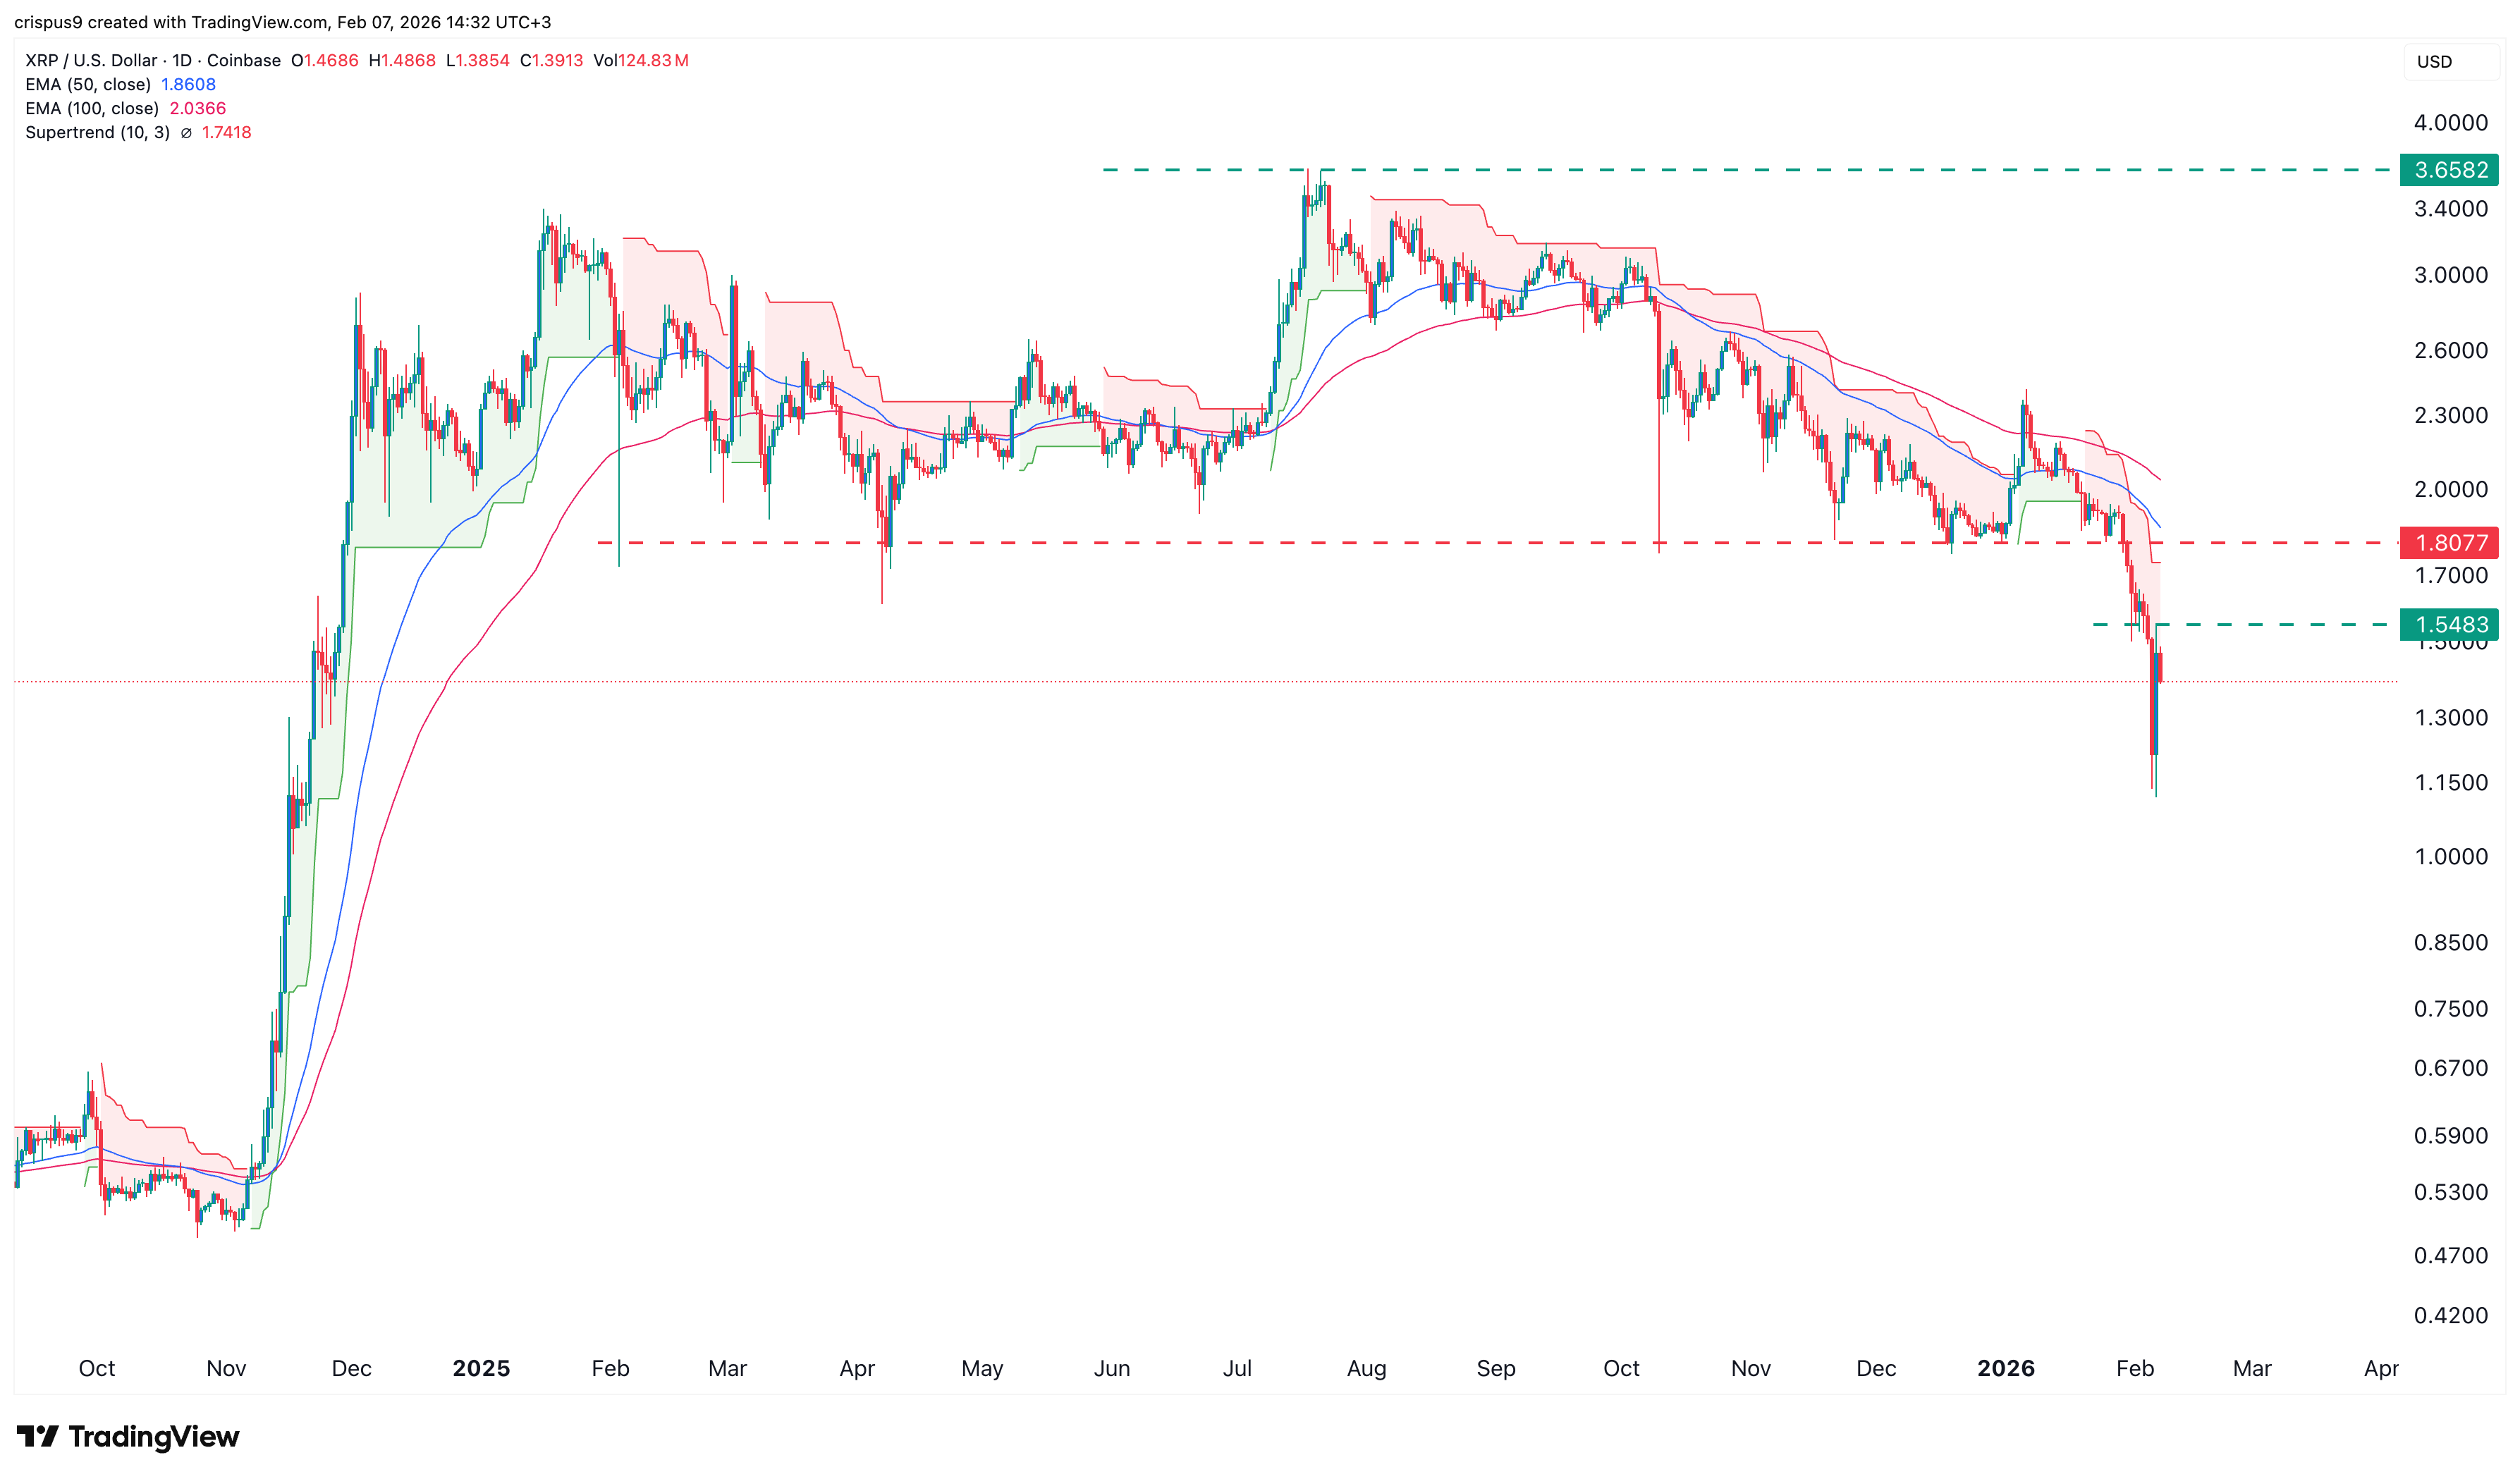
The daily timeframe chart shows that the XRP price has been in a strong freefall in the past few months, moving from a high of $3.65 to a low of $1.1161 this week. It then rebounded on Friday, reaching a high of $1.5483.
The coin remains below all moving averages, while the Supertrend indicator is red, a sign that bears are in control for now. It also remains below the key resistance level at $1.8077, its lowest level in February, April, and October last year.
Therefore, the most likely scenario is where the coin resumes the downtrend, and moves to the year-to-date low of $1.10. It may also drop to the key support level at $1.00. On the other hand, a move above the resistance level at $1.80 with invalidate the bearish outlook.
READ MORE: SCHD ETF Stock is Thriving in 2026 as QQQ, VOO, and Crypto Crash