


Bitcoin price retreated for three consecutive weeks, reaching a low of $60,000 on Friday. It then rebounded sharply and moved above the key resistance level at $70,000 as investors bought the dip and the Crypto Fear and Greed moved to the extreme fear zone. The coin has now flagged a highly bullish chart pattern, pointing to a sustained relief rally this week.
Bitcoin Price Prediction: Hammer Candle Points to More Gains
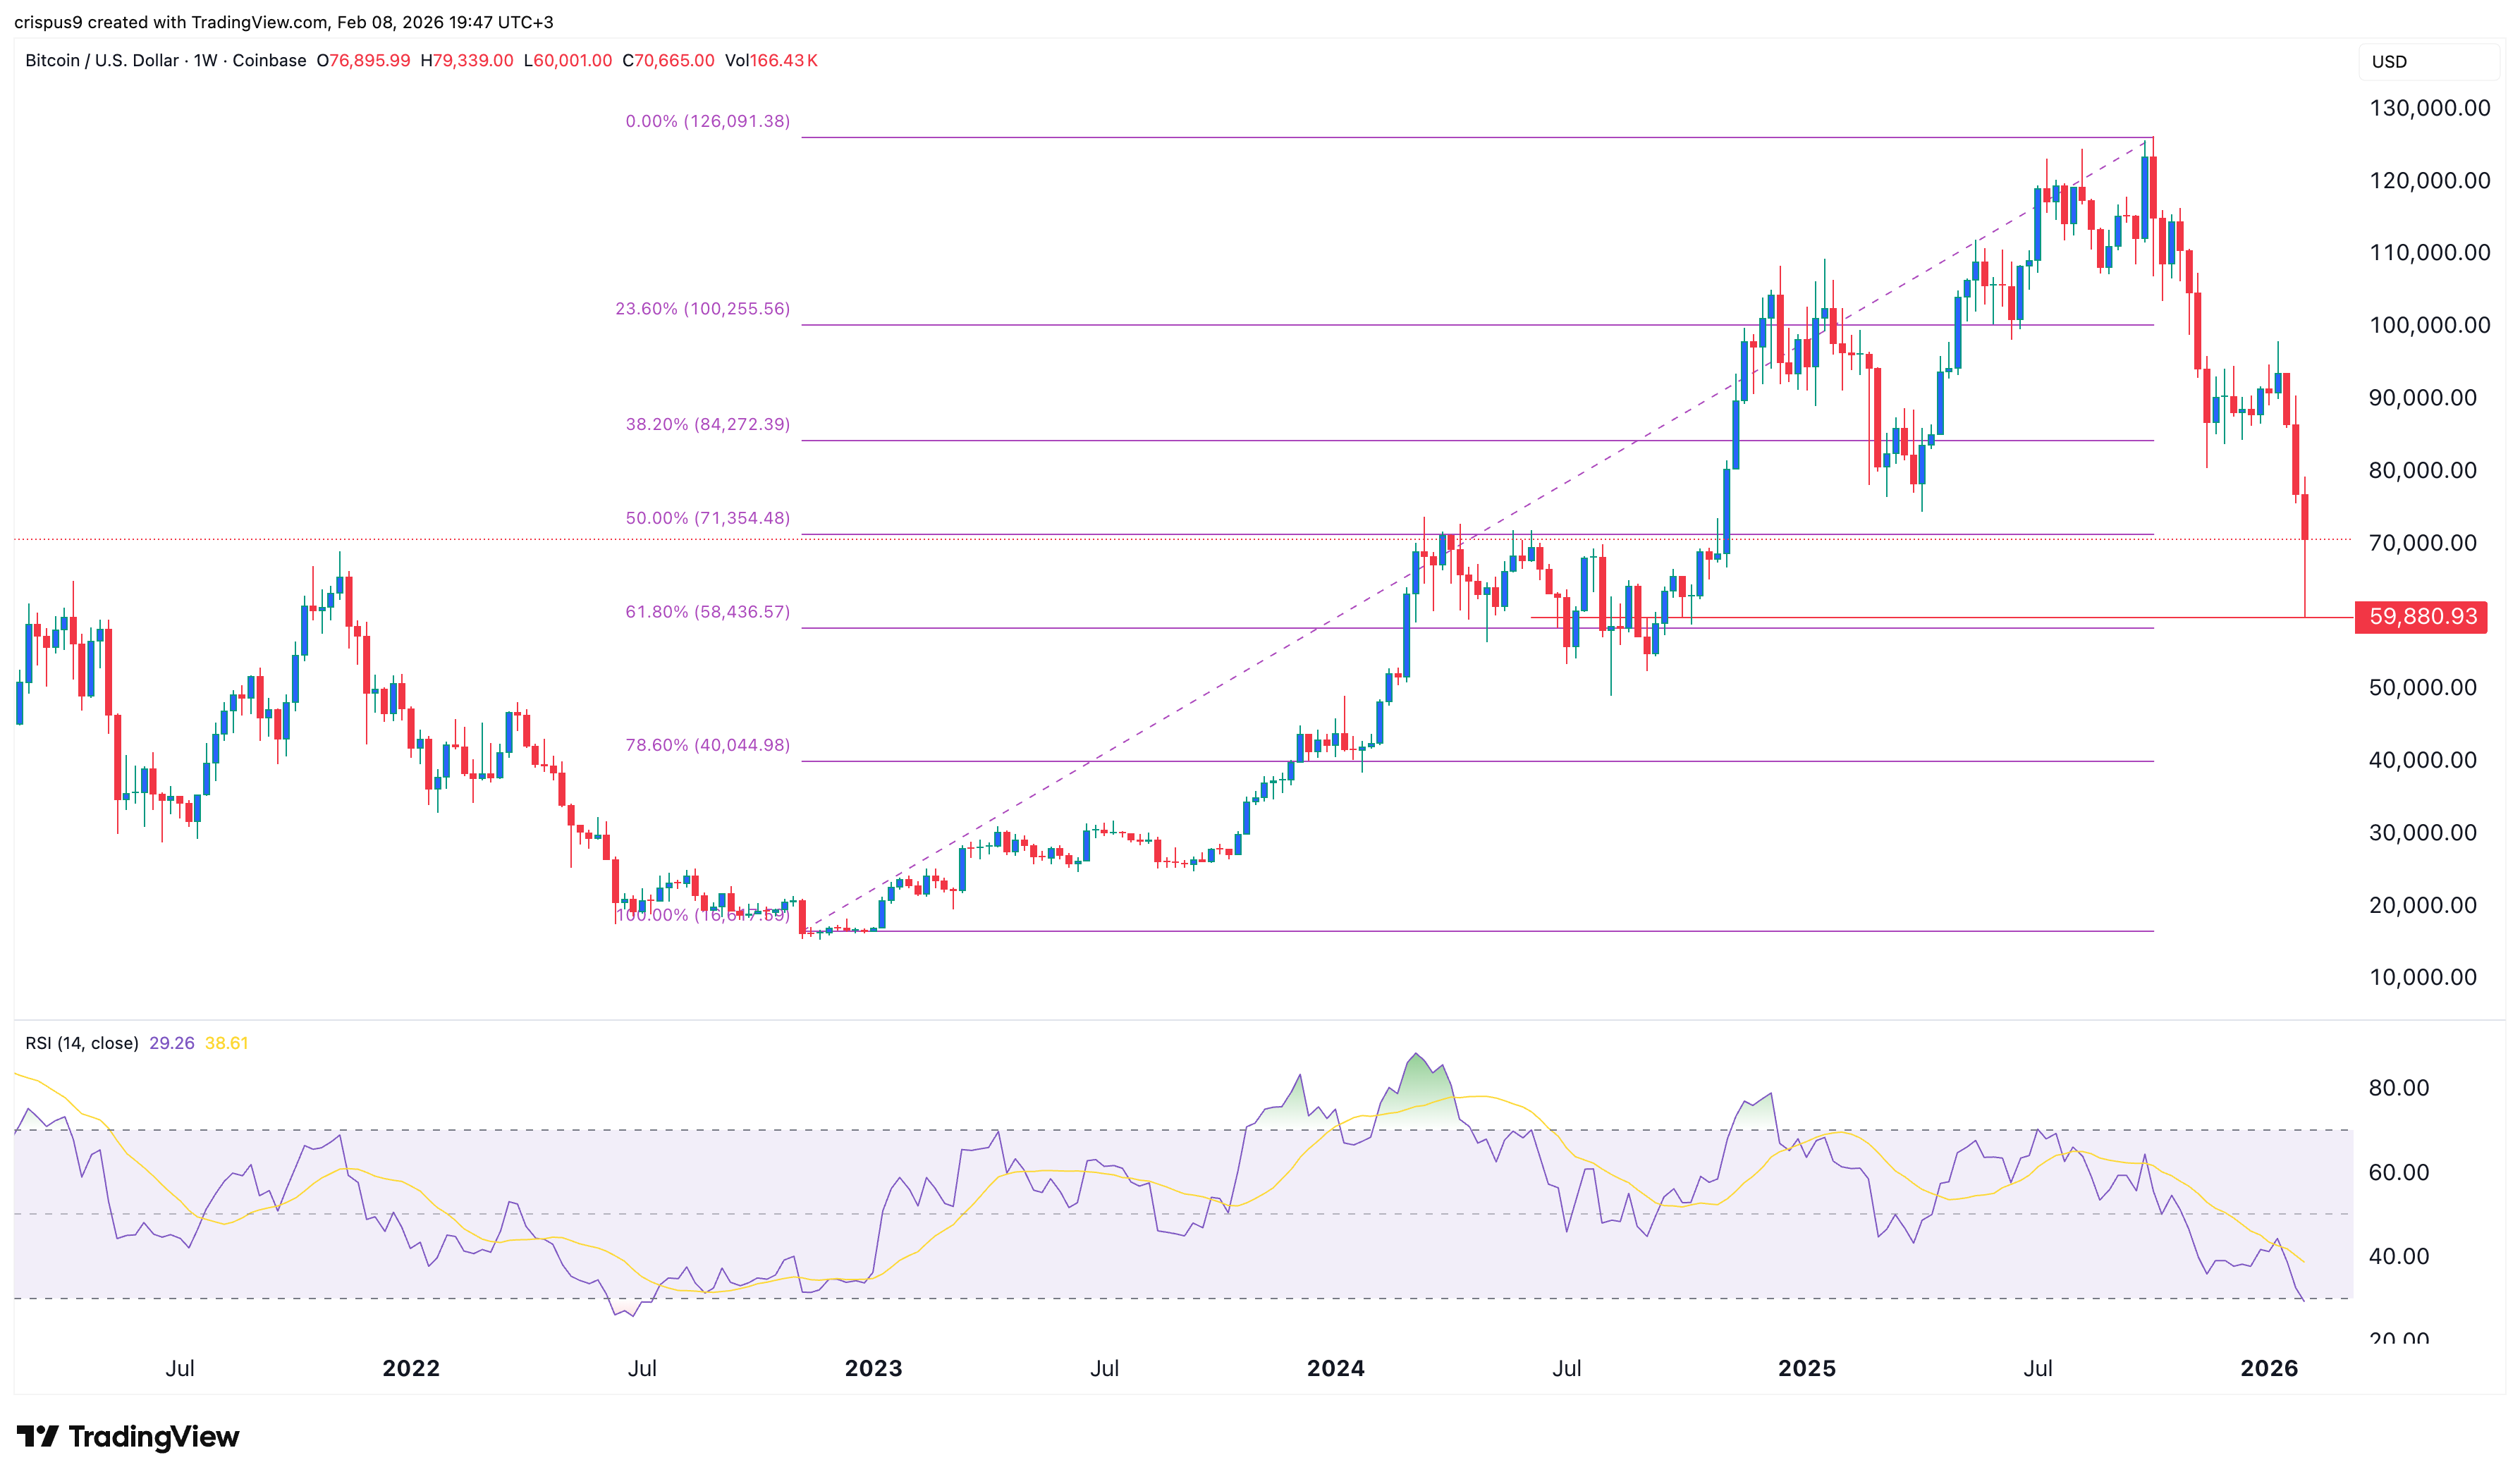
The weekly chart below shows that BTC price has flagged a few bullish patterns, pointing to more short-term gains. One of these patterns is known as hammer, which is made up of a long lower shadow and a small body and a long lower shadow.
The lower side of the shadow coincided with the 61.8% Fibonacci Retracement level, where most rebounds normally happens. At the same time, the Relative Strength Index (RSI) has moved to the oversold level of 30. The last time this happened was in July 2022 when it was trading at $17,000. It then started a prolonged rally, pushing it to the highest point on record.
READ MORE: Tom Lee Makes the Case for BMNR Stock as BitMine Shares Implode
Therefore, the coin will likely continue rising as bulls target the next key resistance level at $80,000. A rebound above that level will point to more gains, potentially to the key point at $100,000.
However, the caveat, as we wrote on Saturday, is that the ongoing crypto market rally could be part of dead-cat bounce (DCB). A DCB is a situation where an asset in a free-fall bounces back briefly and then resumes the downtrend.
Bitcoin Rally Normally Starts When the Fear and Greed Index is in Extreme Fear
There are a few reasons why the Bitcoin price may be on the cusp of a rebound in the coming weeks. First, as the chart below shows, the Crypto Fear and Greed Index crashed to a multi-year low of 5 last week.
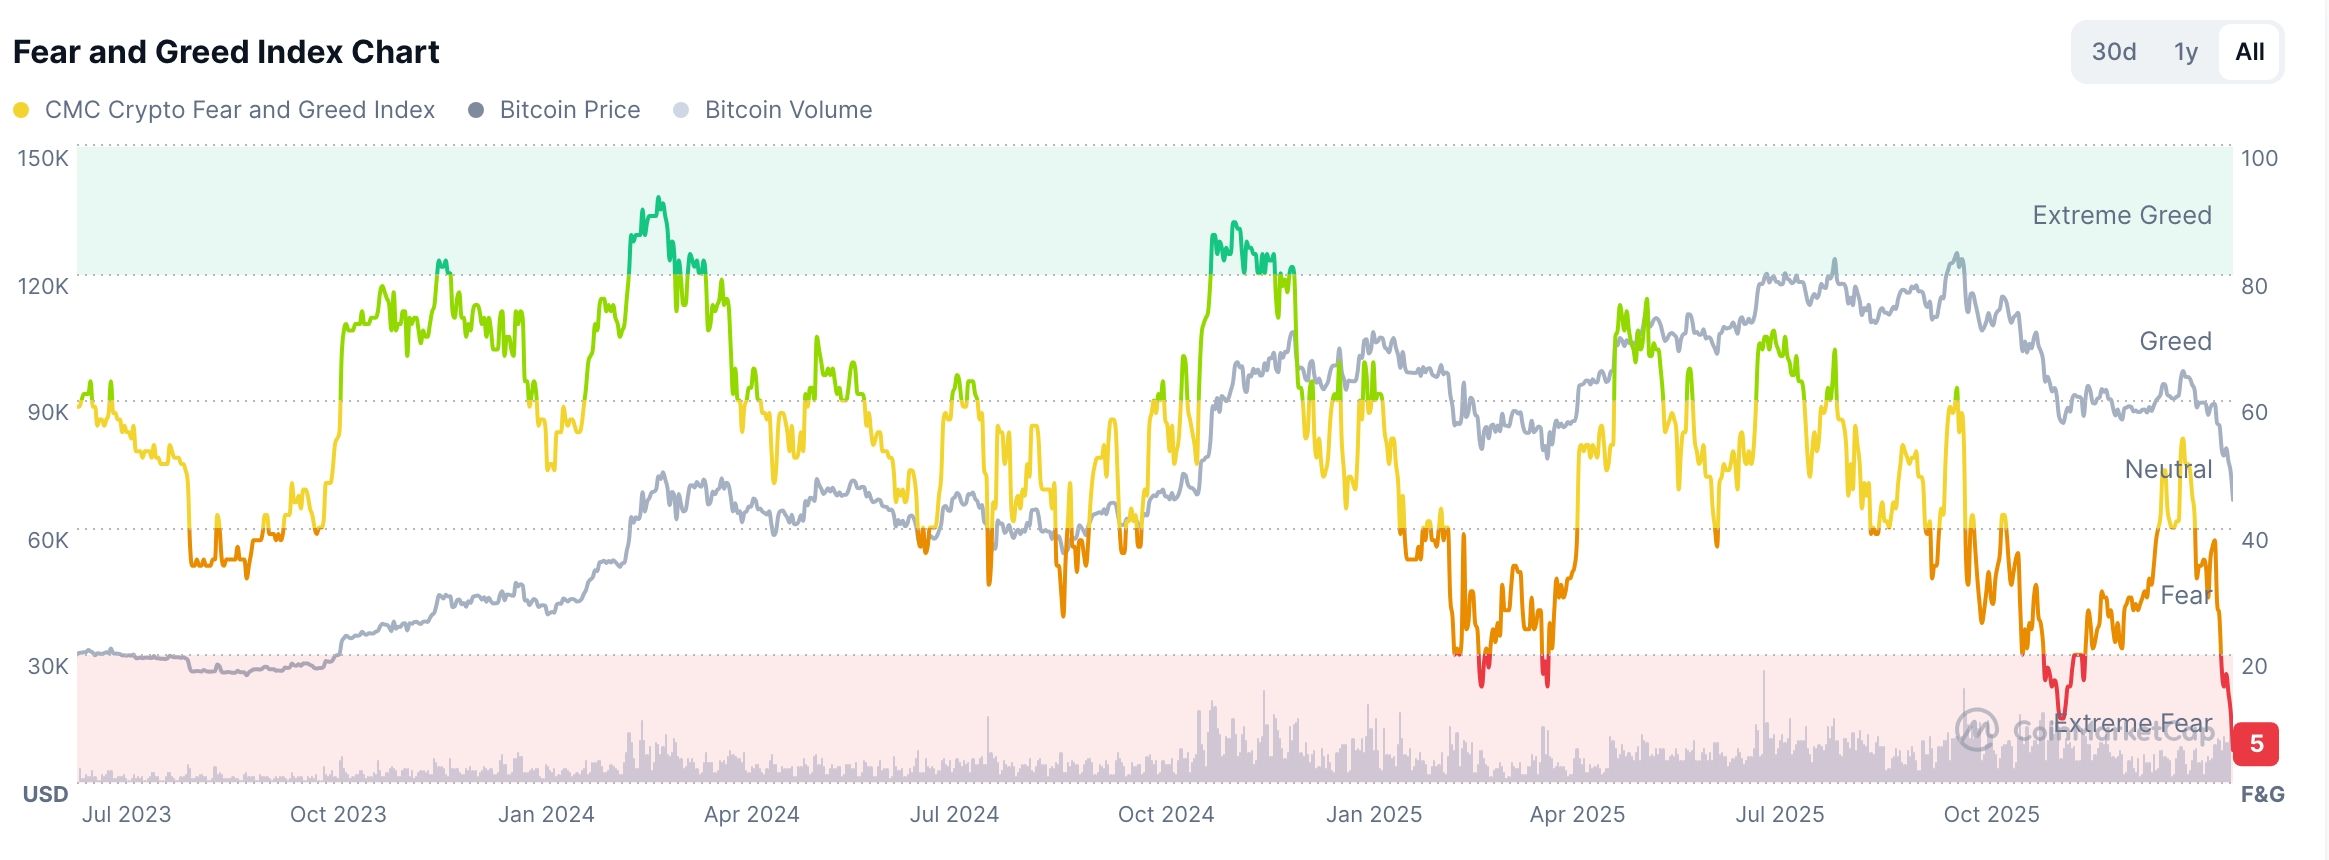
A common Warren Buffett quote recommends buying assets when everyone is fearful and sell when everyone is greedy. Historically, as we saw in April last year and January this year, this quote has worked well in the crypto industry.
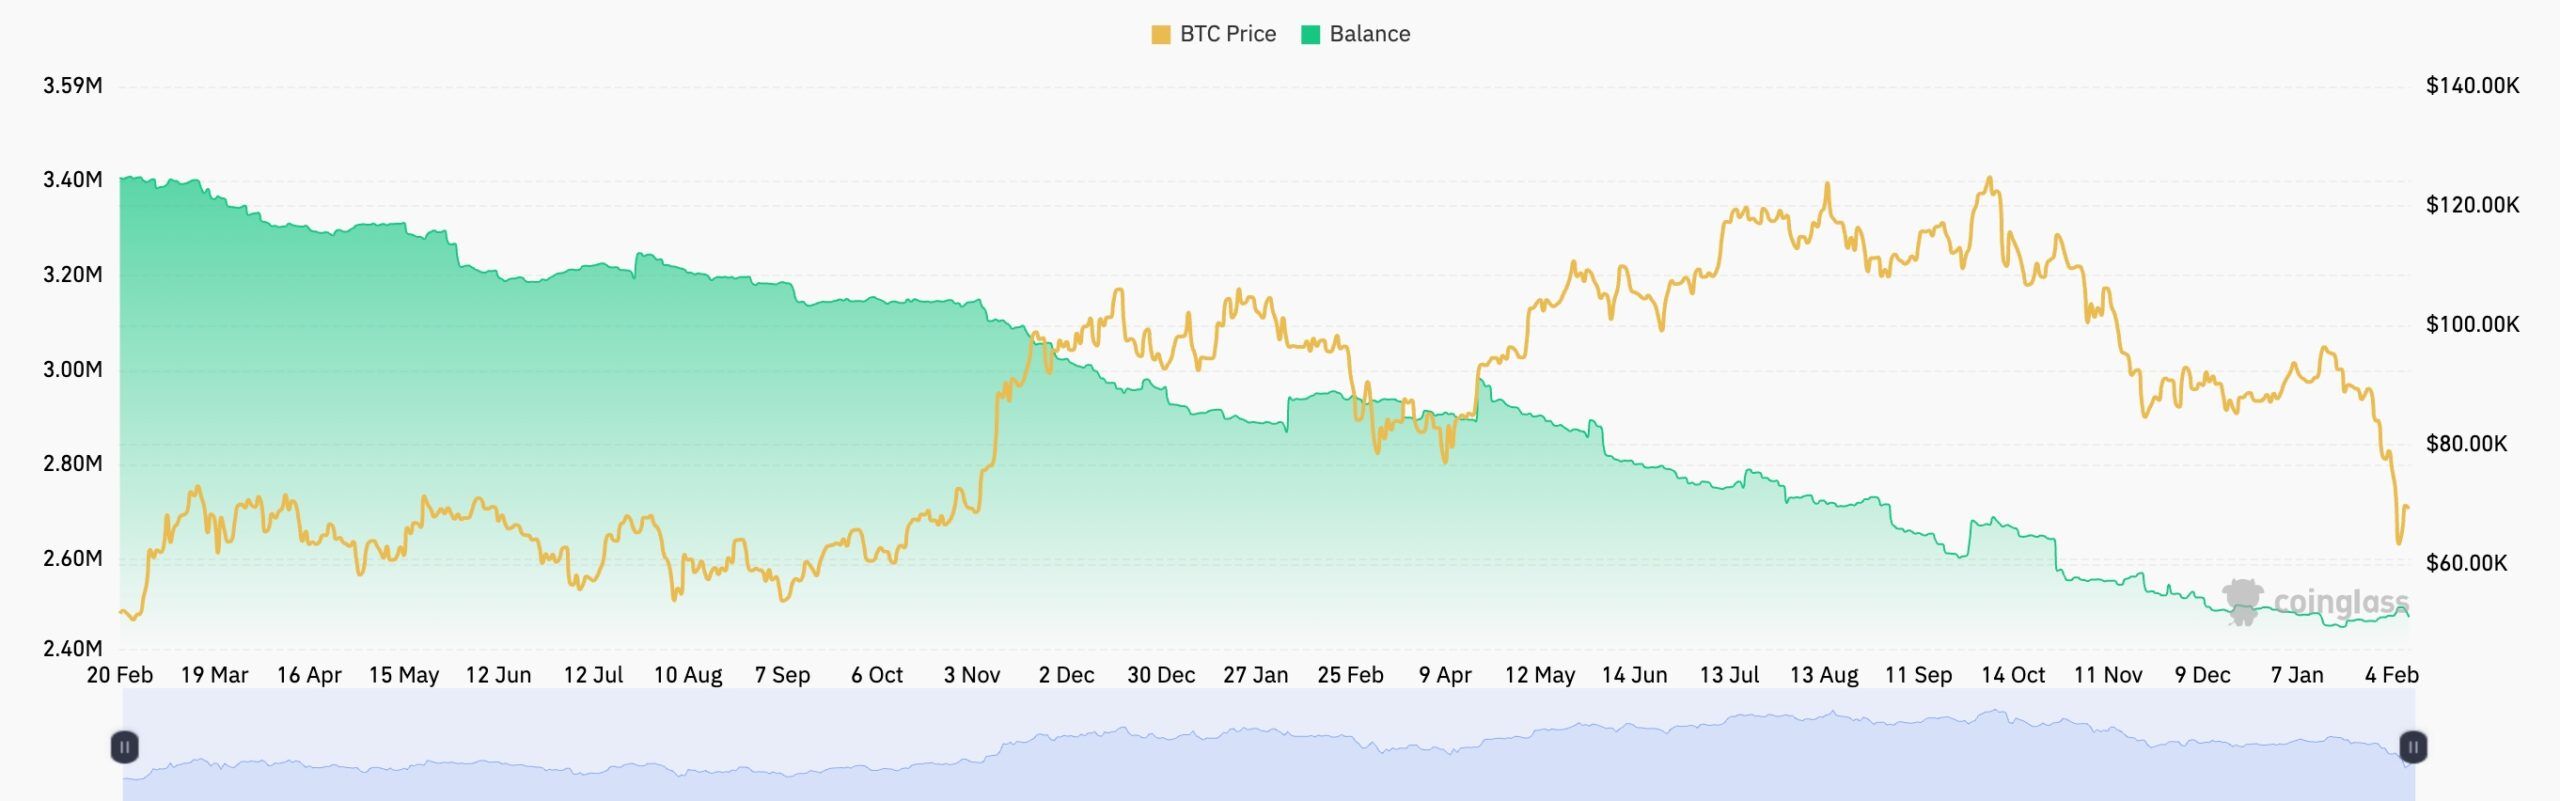
Second, while spot Bitcoin ETF outflows have soared, there are signs that demand is still steady. A good example of this is the falling supply of Bitcoin in exchanges, which has continued falling in the past few months.
Finally, Bitcoin has moved from near zero in 2009 to over $70,000 today and to $126,200 at its all-time high. This surge has not been in a straight line. Instead, the coin has suffered major drawdowns in the past.
In all these crashes, there was an elevated fear that it was the end. A good example of this was during the FTX and Terra crash in 2022 and at the onset of the pandemic. The coin always rebounds from these crashes, which might happen this year.
READ MORE: XRP Price Risks Steep Crash Despite Rising ETF Inflows and Utility Growth