


Bitcoin price slumped today, February 13, as investors waited for the latest US inflation report. It also remained under pressure after Standard Chartered lowered its target, ETF outflows continued, and futures open interest plunged. It was trading at $66,700, down sharply from its all-time high of $126,200.
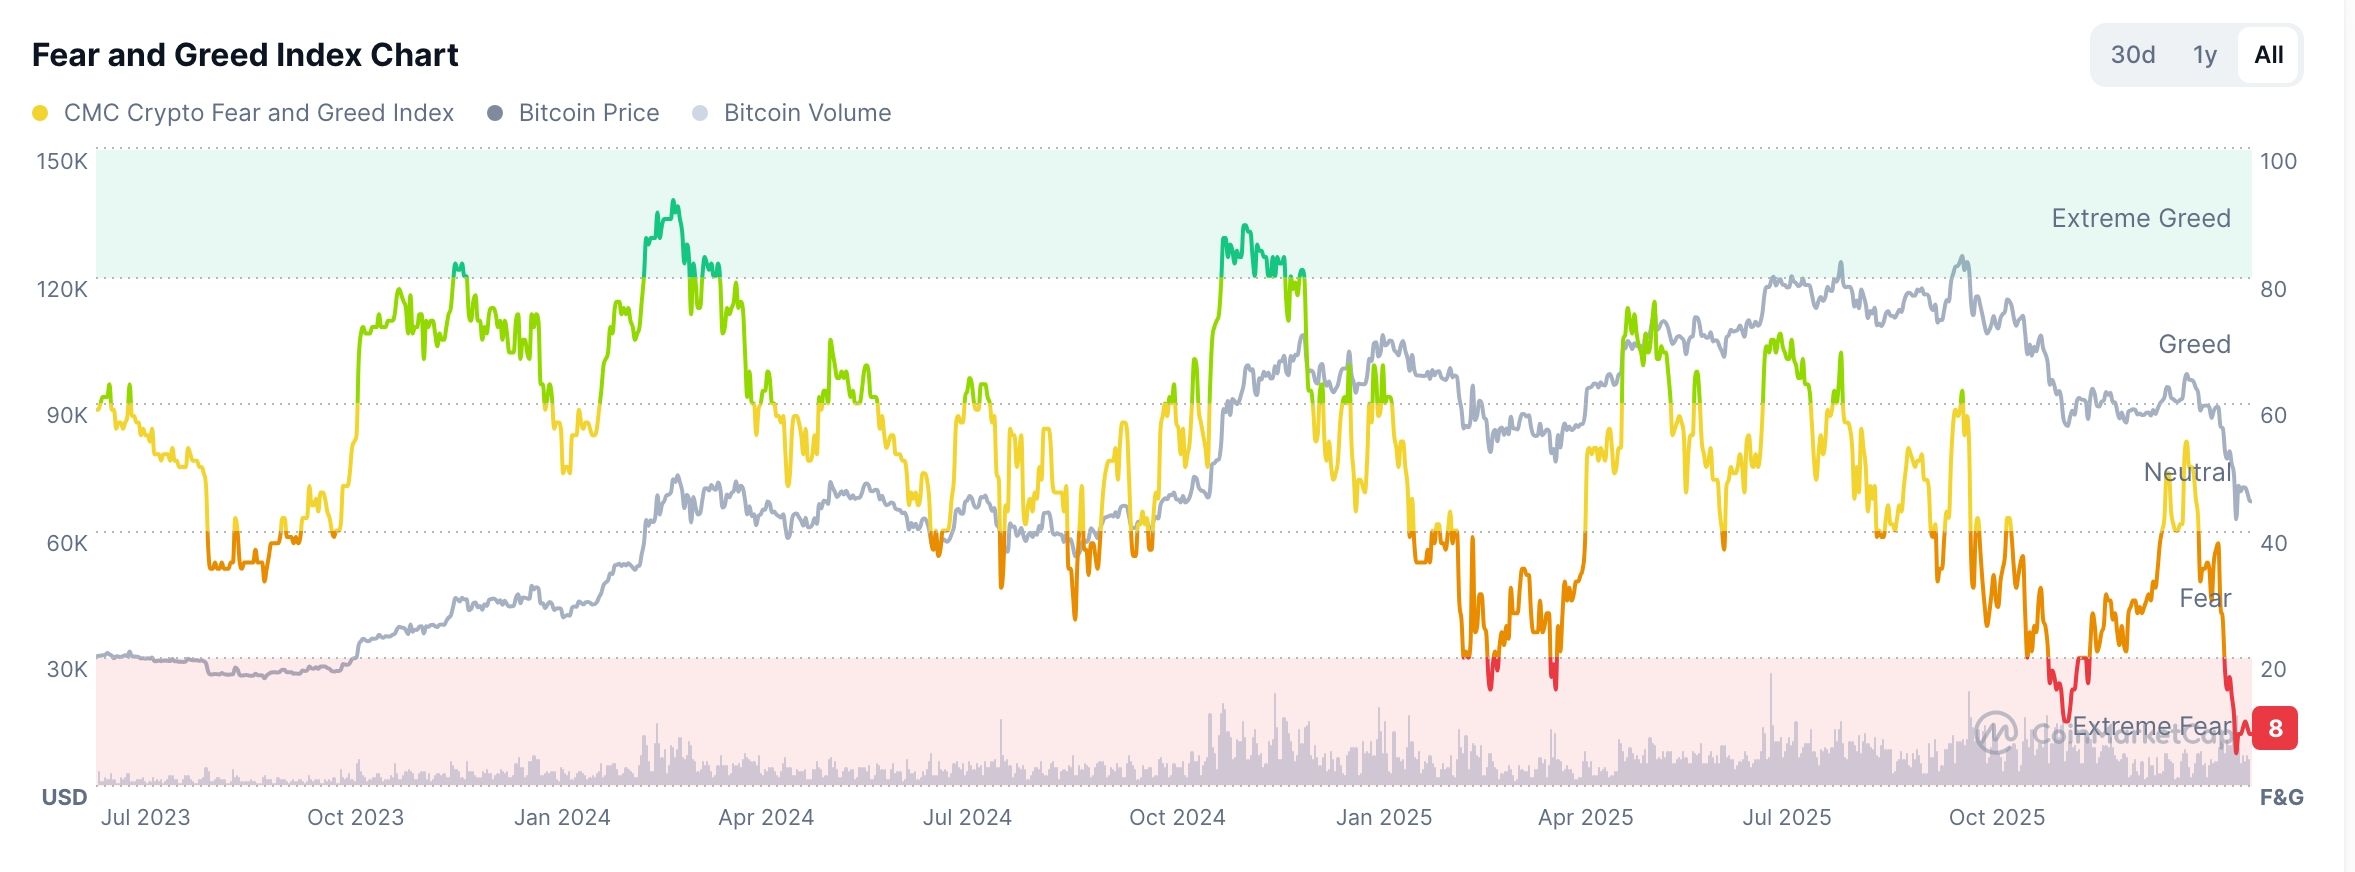
Bitcoin Price Dips as Fear and Greed Index Dips
BTC price retreated sharply as market participants waited for the upcoming US inflation report. Economists polled by Reuters expect the report to show that US inflation dropped to 2.5% in January, while core CPI moved to 2.6% during the month.
In theory, a lower inflation reading should boost risky assets like Bitcoin and other altcoins. That’s because the report would make it easy for the Federal Reserve to start cutting interest rates.
READ MORE: Crypto Market Crash Today: Reasons Why BTC and Altcoins are Going Down
However, in practice, there are signs that Bitcoin is no longer reacting to Federal Reserve action these days. It has slumped by nearly 50% from its October high even though the bank has delivered three rate cuts.
Bitcoin price remains under pressure as a sense of fear spreads in the market. Data compiled by CoinMarketCap shows that the Crypto Fear and Greed Index has slumped to 8.
This fear escalated on Thursday after Standard Chartered downgraded Bitcoin. It has now lowered its target from $300,000 to $150,000 to $100,000 today. Worse, the top crypto analyst warned that the coin may crash to $50,000 before rebounding to $100,000 at the end of the year.
The ongoing fear has pushed American investors to dump their Bitcoin ETF holdings. ETF outflows stand at over $693 million this month, with the four-month total soaring to over $6.8 billion.
At the same time, Bitcoin’s futures open interest has slumped from last year’s high of $94 billion to the current $44 billion. Falling open interest has escalated after the recent liquidation event in October last year.
BTC Price Prediction: Technical Analysis
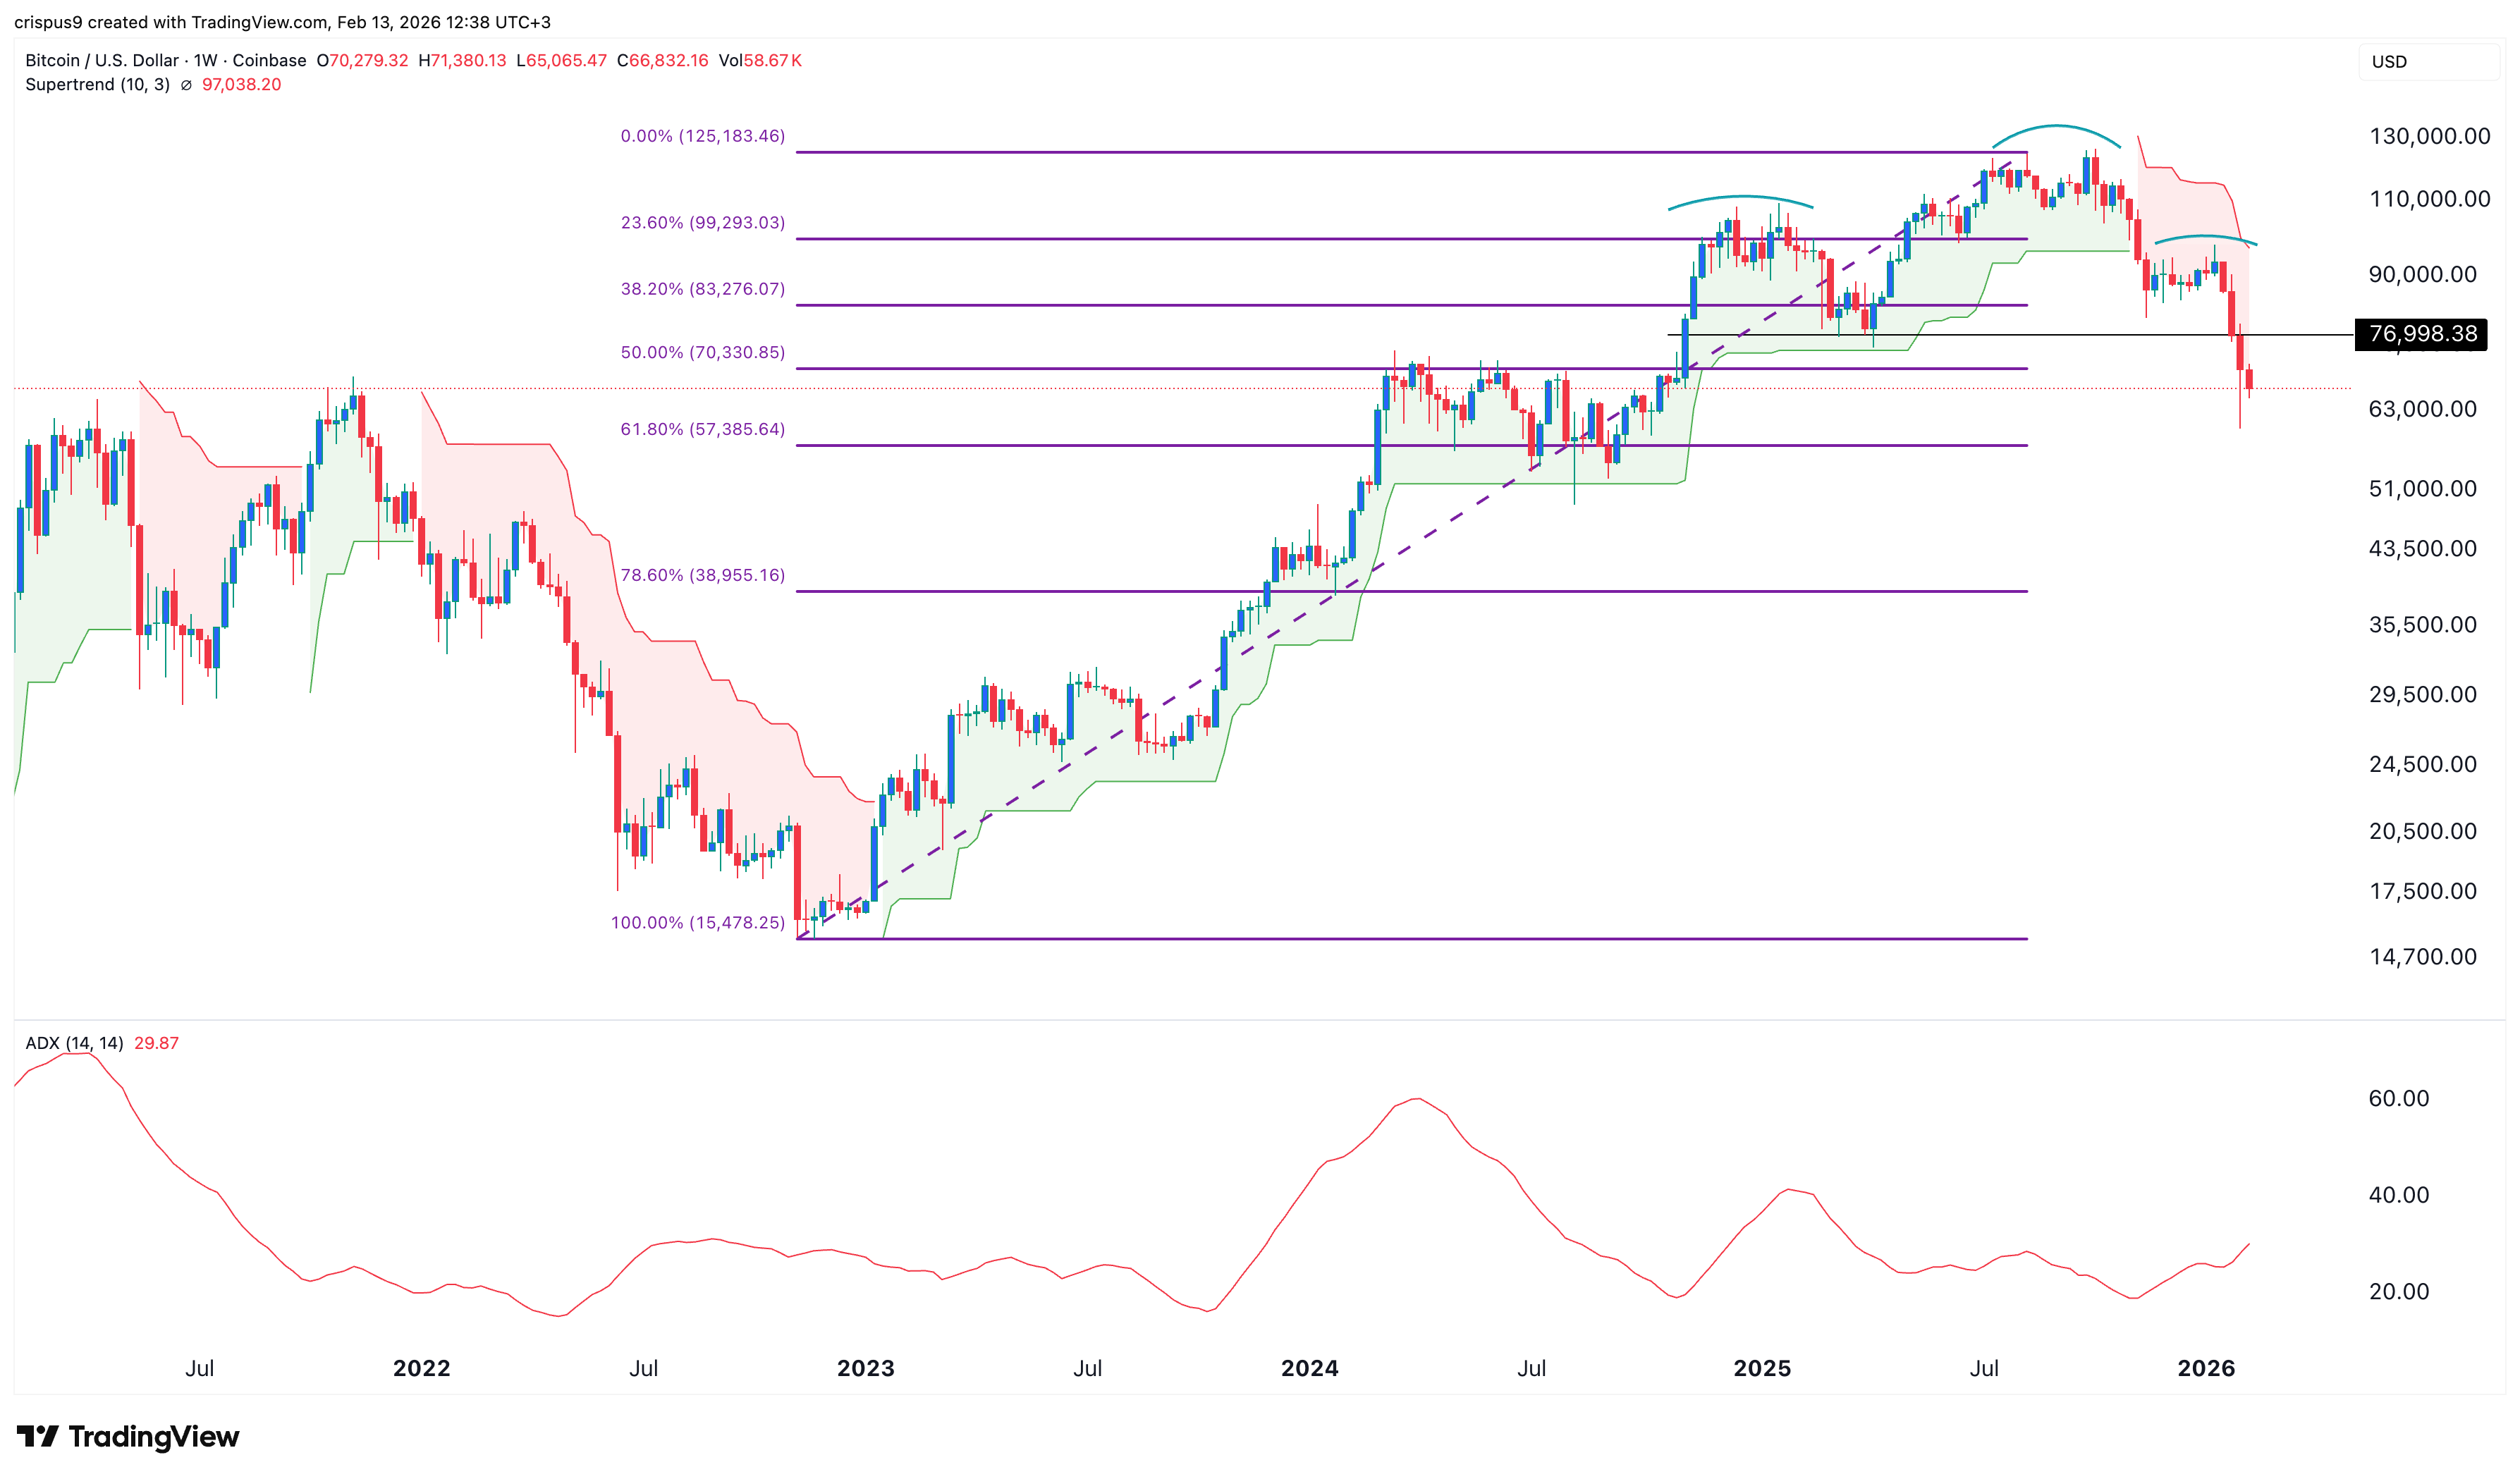
Technical analysis suggests that Bitcoin price has more downside in the near term. It has slumped below the 50-week and 100-week Exponential Moving Averages (EMA). Most notably, the coin has flipped the Supertrend indicator from green to red, which is a common bearish sign in technical analysis.
The coin has also plunged below the 50% Fibonacci Retracement level. At the same time, the Average Directional Index (ADX) has jumped to 30, its highest level in months. A soaring ADX indicator is a sign that the downtrend is strengthening. It has also formed a head-and-shoulders pattern.
Therefore, the most likely BTC price prediction is bearish, with the initial target being this month’s low of $60,000. A crash below that level will point to more downside, potentially to Standard Chartered’s target of $50,000.
READ MORE: Cardano Price Sits at a Make-or-Break Level Ahead of Midnight Mainnet Launch