


Bitcoin price remained on edge on Tuesday as the recent consolidation continued. It has formed a risky chart pattern on the daily chart, pointing to an eventual retreat as Scott Ritter and other top analysts predicted that Donald Trump would eventually launch an attack on Iran. BTC price was trading at $68,000, down sharply from the all-time high of $126,300.
Scott Ritter and Other Top Analysts Predict Trump Iran Attack
A major risk facing the Bitcoin price is that Donald Trump will eventually attack Iran and seek regime change in the country. In a statement on Monday, Scott Ritter, a popular analyst, predicted that Trump was using the ongoing talks with Iran as a delay tactic.
Ritter believes that the odds of a comprehensive deal between Iran and the United States are limited, and the US is seeking concessions that Iran will not be comfortable with. For example, the US and Israel have demanded that Iran dismantle its ballistic missile program and stop funding proxies in the region.
READ MORE: Internet Computer’s ICP Price Forms a Large Double Bottom as Whales Buy
Trump has already sent an armada to the region, and recently, he has sent another carrier group, which will arrive in the next few weeks. Iran, on the other hand, has warned that any US attack will lead to a prolonged regional war that will lead to higher crude oil prices and geopolitical tensions.
Historically, Bitcoin price tends to decline whenever geopolitical risks rise, as its role as a safe-haven asset has faded.
Bitcoin price is also at risk of a big drop because of the fading liquidity during the Lunar New Year in China. China is still one of the top participants in the crypto industry despite the fact that Beijing has officially banned the industry.
Data shows that volume in the spot market and the futures open interest have dropped in the past few months. Futures open interest has dropped to $43 billion from last year’s high of $95 billion.
Bitcoin Price Prediction: Technical Analysis
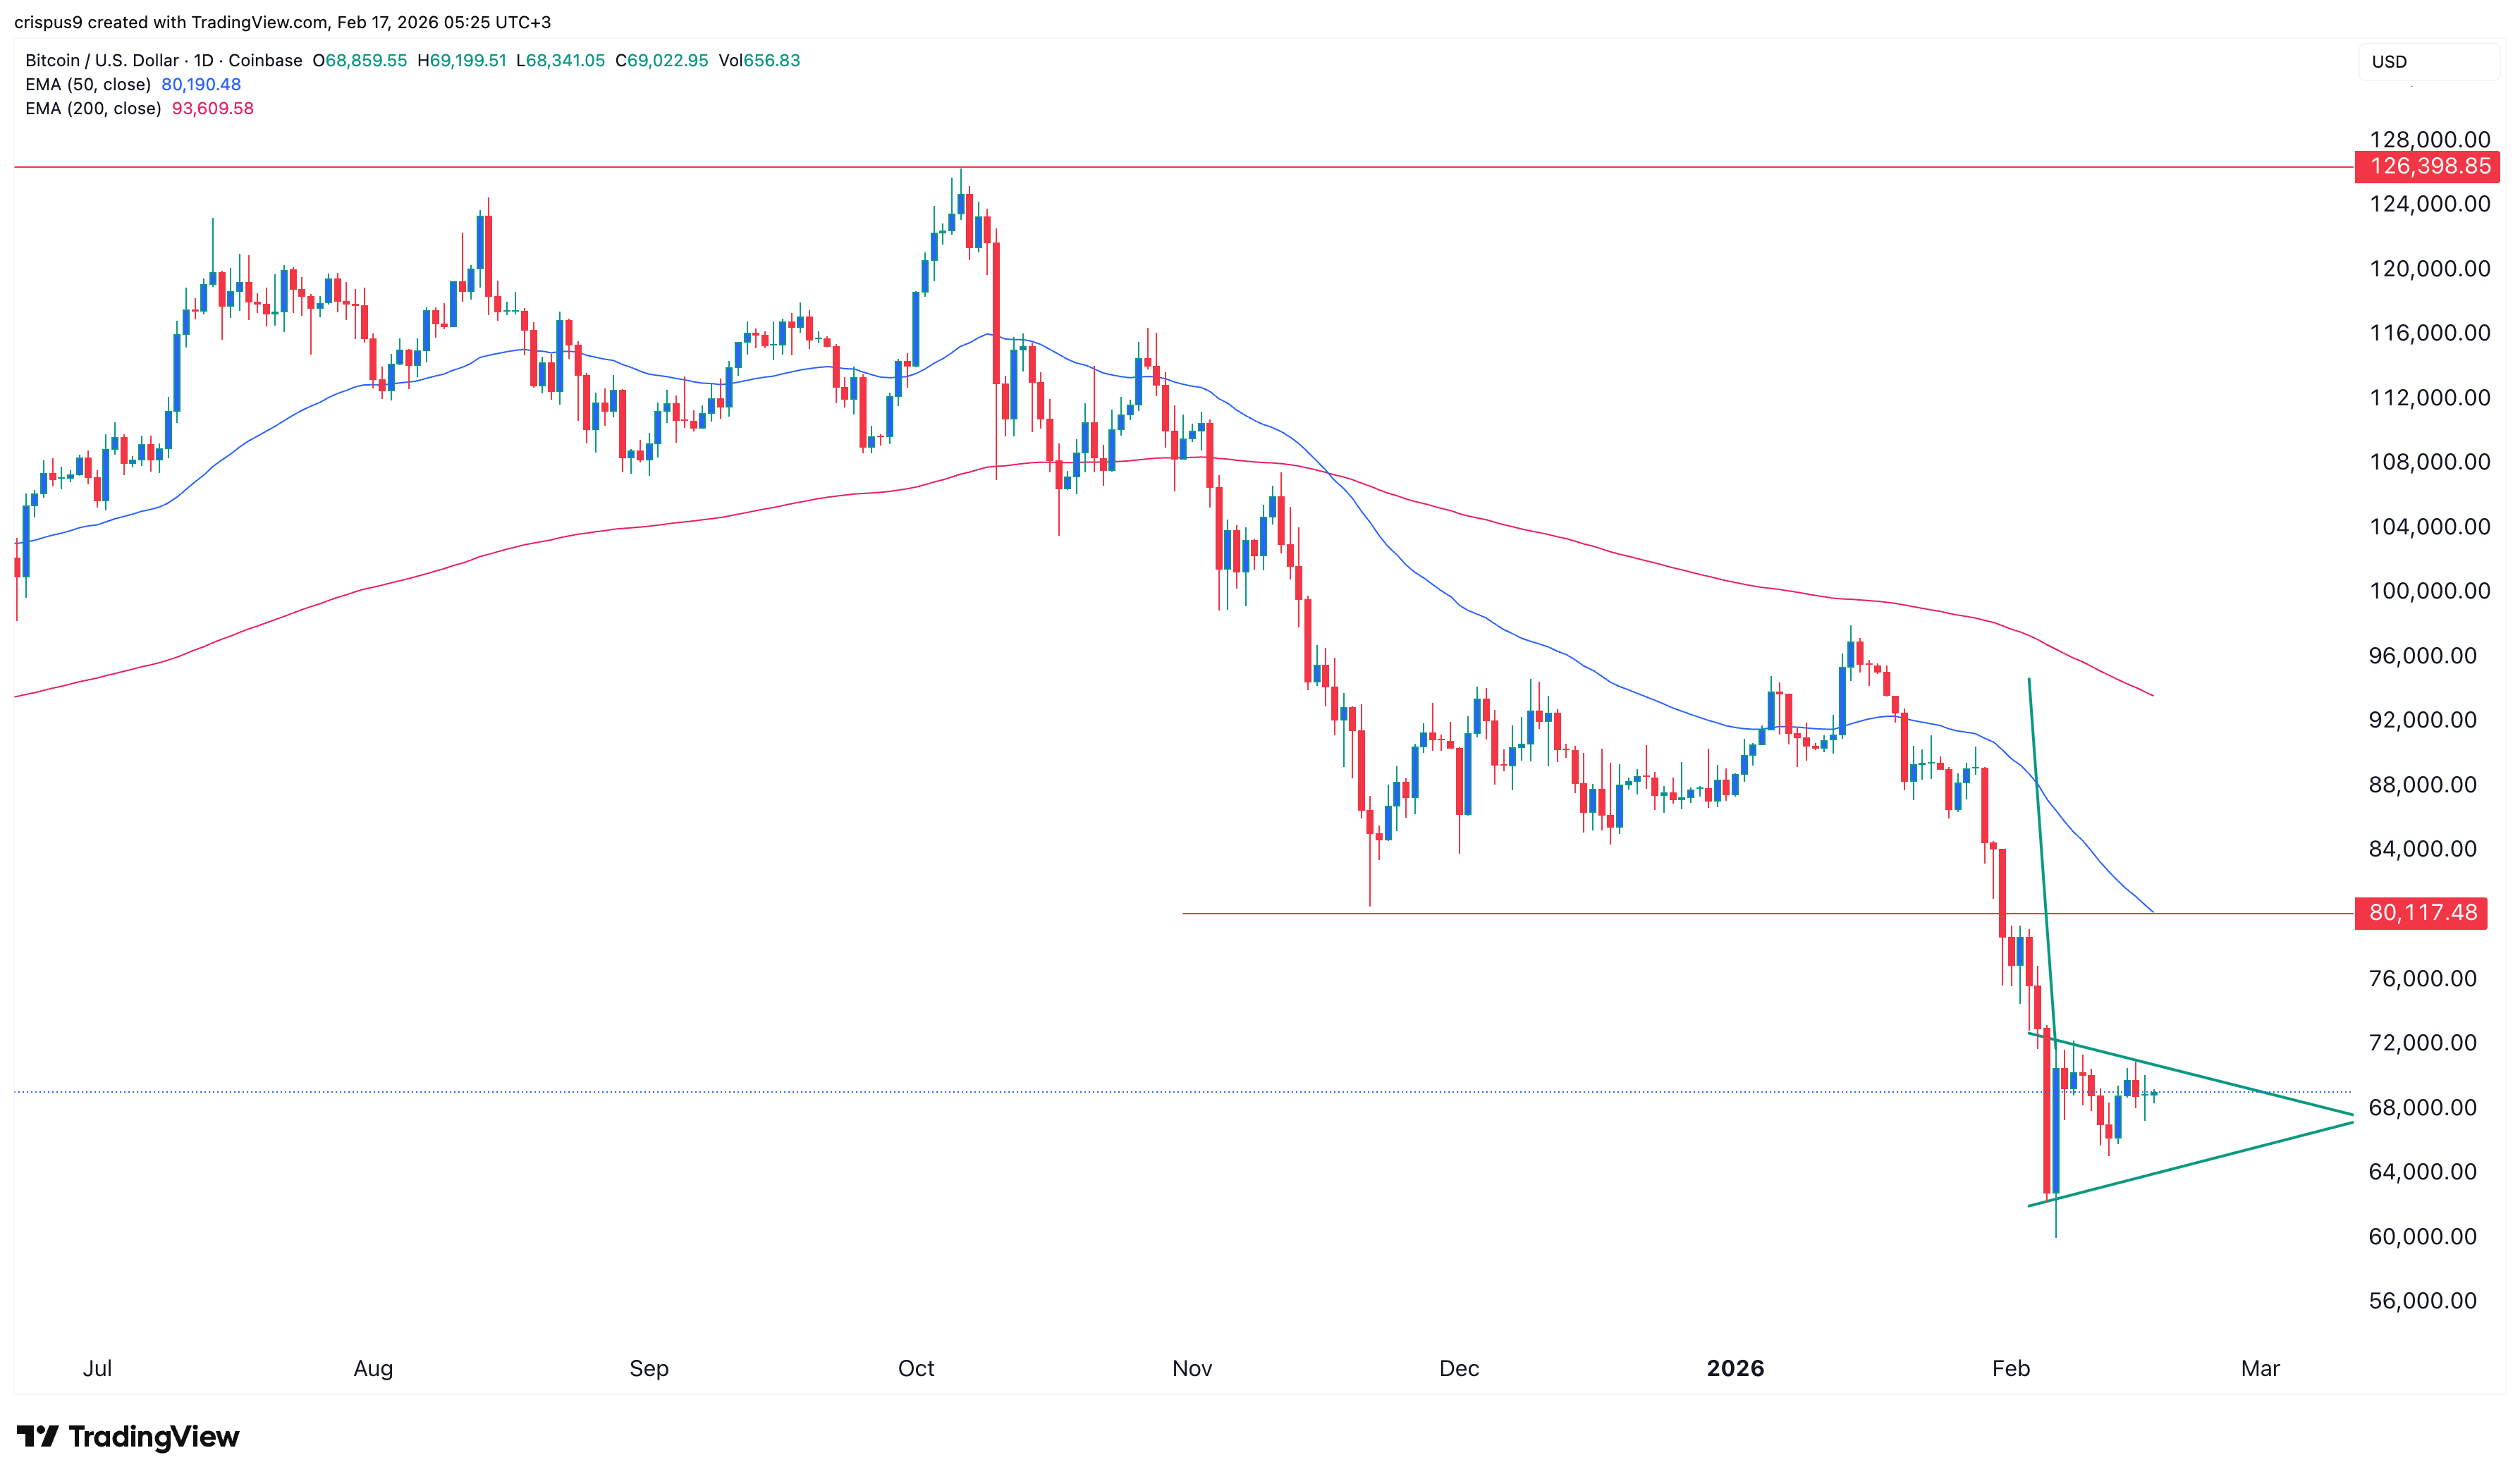
The daily timeframe chart shows that Bitcoin price has slumped in the past few months, moving from a high of $126,300 in October last year to the current $68,000. It has constantly remained below the 50-day and 100-day Exponential Moving Averages (EMA) and the Supertrend indicators.
The coin is slowly forming a bearish pennant pattern, which is shown in green above. Its two lines are nearing their confluence, which normally leads to a bearish breakdown. If this happens, the coin may drop to the year-to-date low of $60,000.
On the flip side, a move above the important resistance level at $72,000 will invalidate the bearish outlook and point to a brief rebound.
READ MORE: Solana Price Prediction: Growth Continues, But Risks Point to $50 Decline