


Ethereum price has moved sideways in the past few weeks as demand in the spot, futures, and ETF markets waned. ETH token was trading at $1,955 on Sunday, much lower than the all-time high of nearly $5,000. It has also formed a risky pattern, pointing to more downside in the coming weeks.
Key Ethereum Metrics Have Sunk Lately
Third-party data is sending mixed signals about Ethereum. On the one hand, network growth metrics show that the ecosystem is doing well. For example, the total value locked (TVL) in its ecosystem has soared to a record high in ETH terms. That growth has been driven by top networks like Ether.fi, Maple Finance, and Aave.
Additionally, the network’s Real-World Asset (RWA) tokenization ecosystem is thriving. Its total assets have jumped to over $18 billion, with some of the biggest companies leveraging its technology.
As we have written before, Ethereum’s active addresses, transactions, and fees have soared after the Fusaka upgrade. This growth will continue as the network prepares more upgrades this year, including integrating stealth addresses and zero-knowledge (ZK) scaling.
READ MORE: Binance Coin Price Forms Risky Pattern as Key Metrics Tumble
On the other hand, market-related metrics have plunged lately. For example, data compiled by CoinGlass shows that the futures open interest has tumbled to $24 billion from last year’s high of over $70 billion.
More data shows that spot Ethereum ETF outflows have continued this month. These funds have lost over $450 million in assets this month. They lost over $353 million, $616 million, and $1.4 billion in the previous three months.
Therefore, falling ETH ETF and futures market demand is a sign that the coin may remain under pressure in the near term. On top of this, there are geopolitical risks, including a potential US attack on Iran and an escalating trade war.
Ethereum Price Technical Analysis
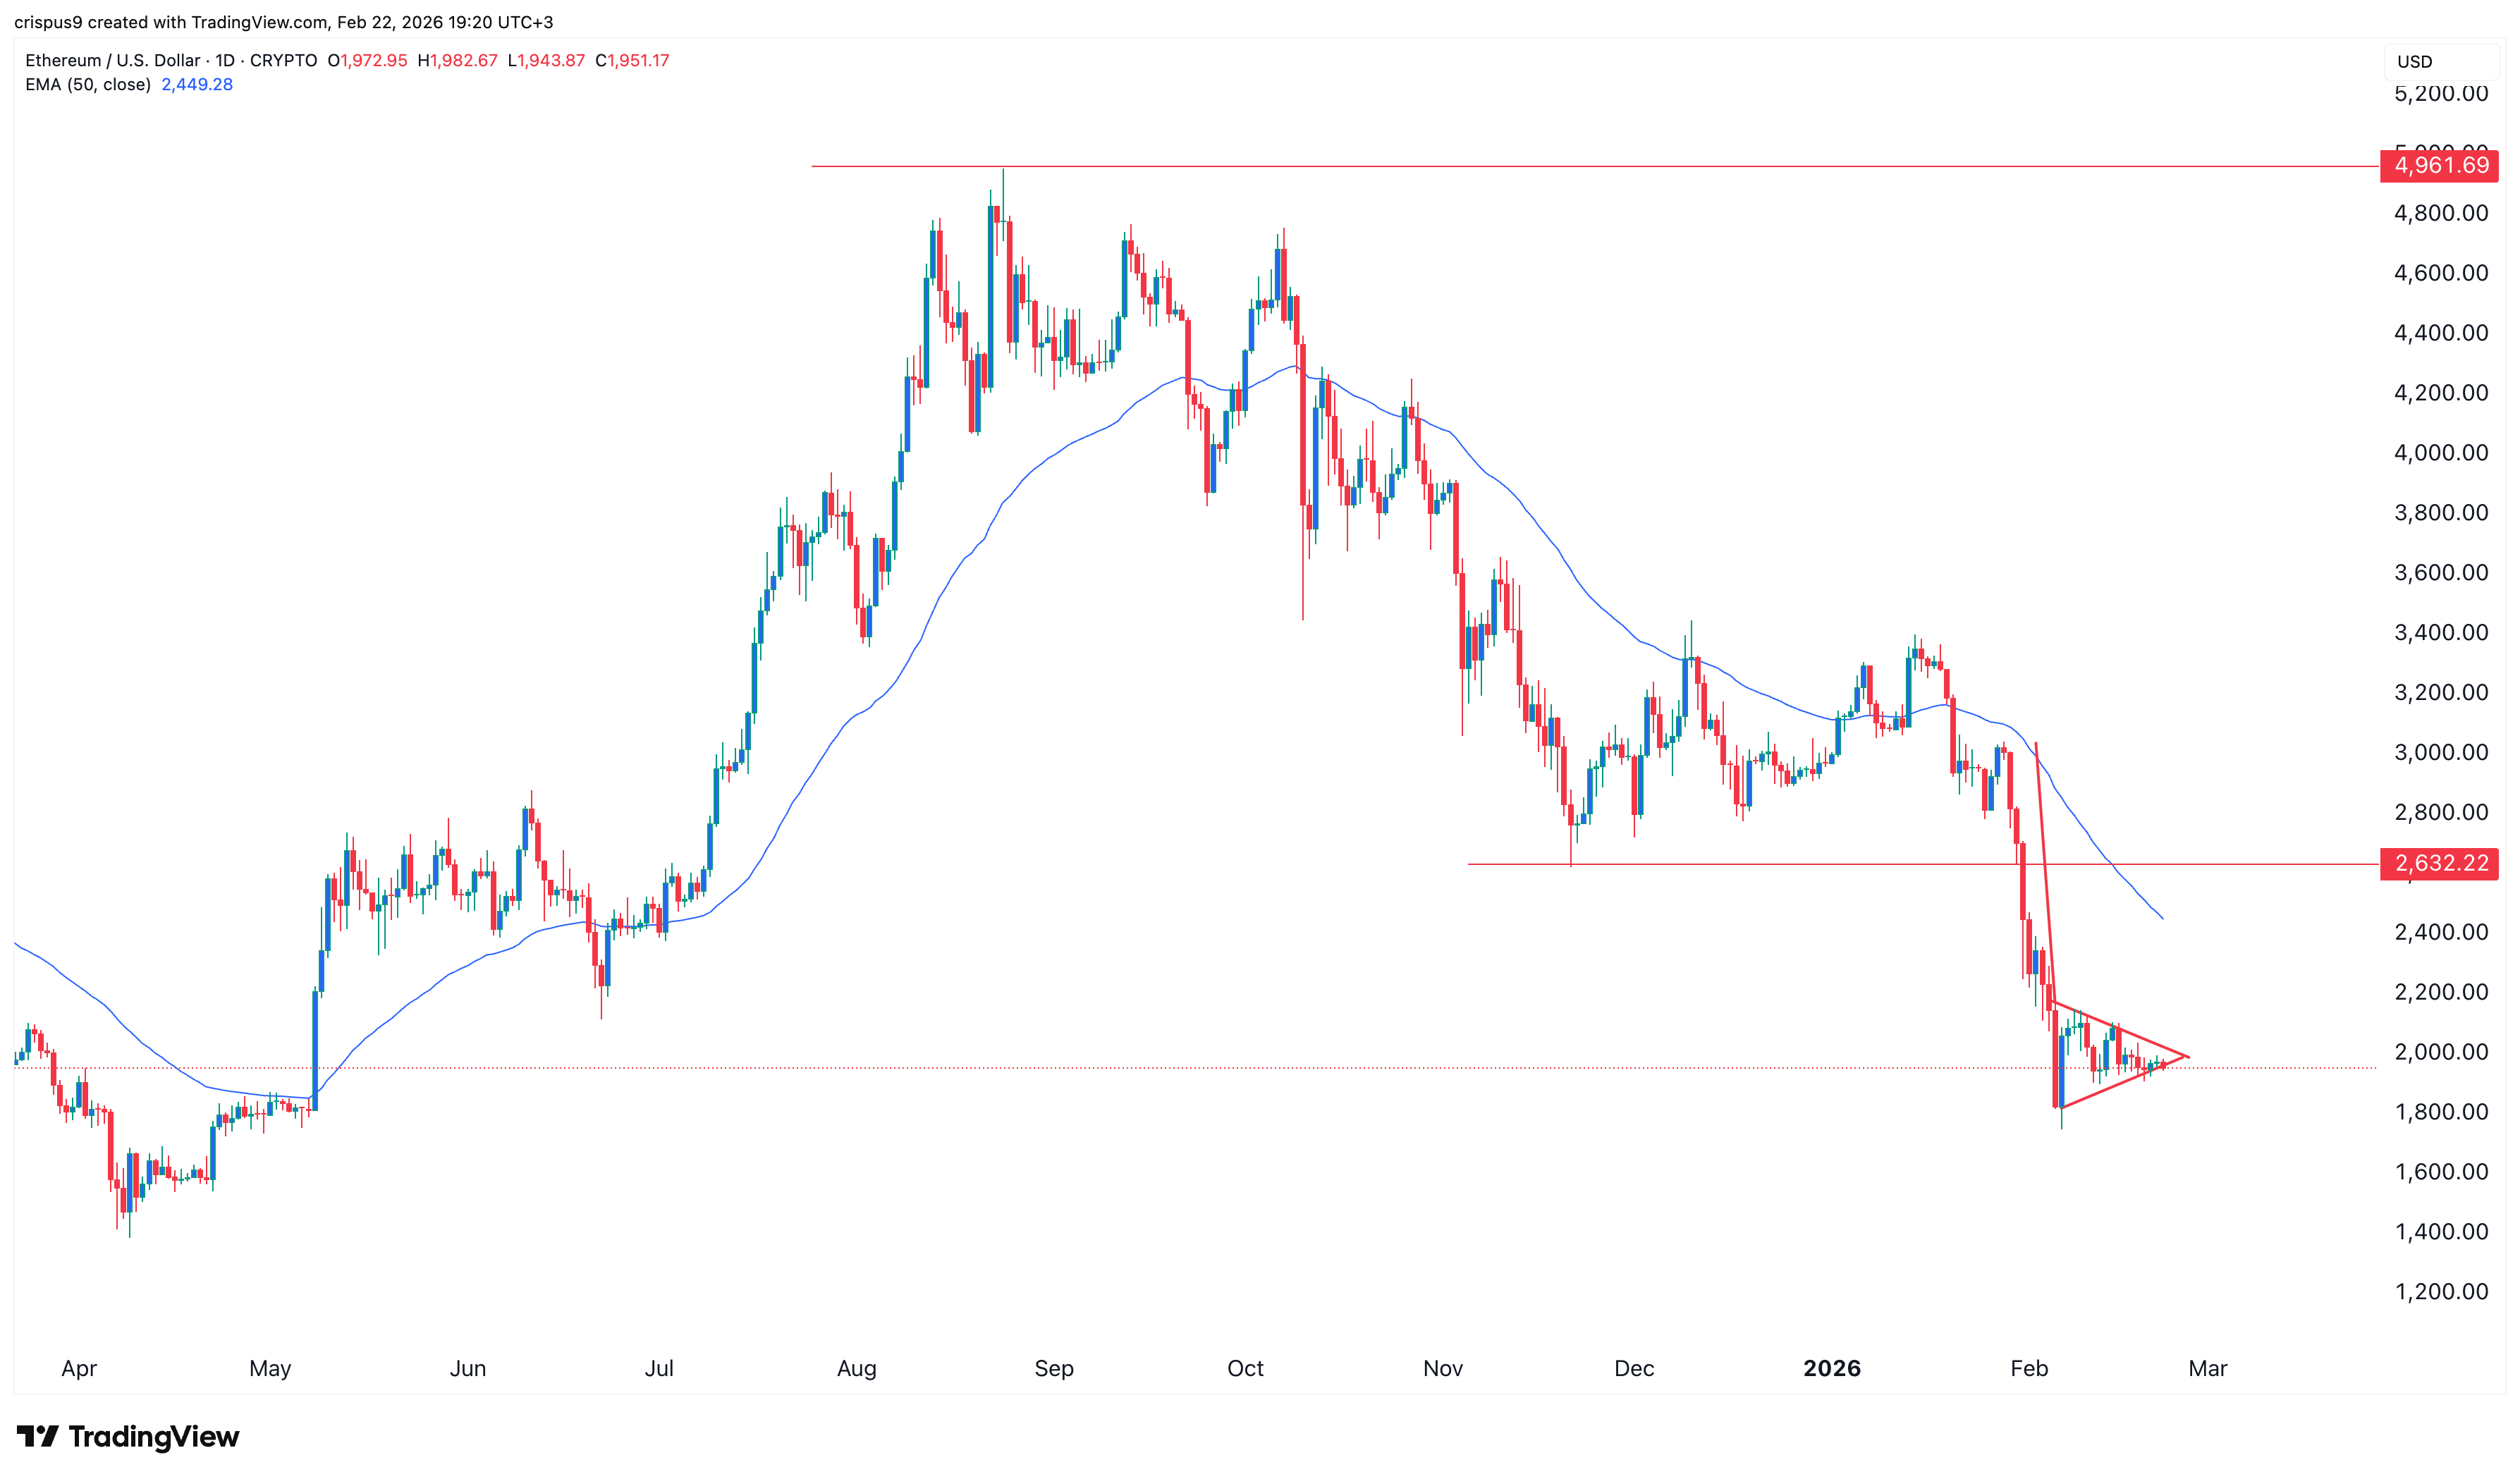
The daily timeframe chart shows that the Ethereum price has slumped in the past few months, moving from a record high of $4,960 to the current $1,950. It has remained below the key support level at $2,630, its lowest level in November, and the lower side of the former bearish flag pattern.
Ethereum price remains below all moving averages, and most importantly, it has formed a bearish pennant pattern, which is made up of a vertical line and a symmetrical triangle.
Therefore, the most likely scenario is where the coin makes a bearish breakdown, potentially to the key support level at $1,500. On the other hand, a move above the key resistance level at $2,500 will invalidate the bearish ETH price forecast.
READ MORE: Pi Network Founders Share Future Plans: Native Tokens, KYC-as-a-Service & More