


Circle stock price has remained under pressure in the past few months, moving from a record high of $298 in June 2025 to the current $63. Its market capitalization has slumped from $60 billion to the current $14 billion. So, what’s next for the stock ahead of its earnings report this week?
Circle Internet Earnings Ahead
The CRCL stock price will be in the spotlight this week as investors react to the upcoming financial results, which will shed more light on the business.
Wall Street analysts expect the financial results to show that its revenue rose to over $744 million, bringing the annual revenue to over $2.72 billion.
The 12 analysts tracking the company expect its EPS to be 16 cents. Its annual EPS is expected to be a $1.3 loss, largely due to IPO costs.
Circle’s business has slowed in the past few months due to the ongoing crypto market crash. Data shows that the USDC market capitalization has struggled in the past few weeks. It has a market cap of $74.4 billion, down from its year-to-date high of $78 billion.
A declining USDC market capitalization is critical for the company because it means its revenue growth will be affected as it generates income.
READ MORE: Ethereum Price at Risk of Crashing to $1,500 as Network and Market Stats Diverge
According to the GENIUS Act, the company can only monetize its stablecoin holdings by investing in short-term government bonds, which are yielding about 4% today.
However, Circle does not retain all its interests due to its deal with Coinbase. In this, Coinbase retains all the interest it earns on its USDC holdings. Its most recent results showed that its stablecoin holdings made over $364 million in the fourth quarter and $1.348 billion last year.
Analysts have scaled back their estimates for the CRCL stock this year. Goldman Sachs set a target of $88, while JPMorgan reduced it from $100 to $90. Zacks Research downgraded its stock to a strong sell.
Circle Stock Technical Analysis
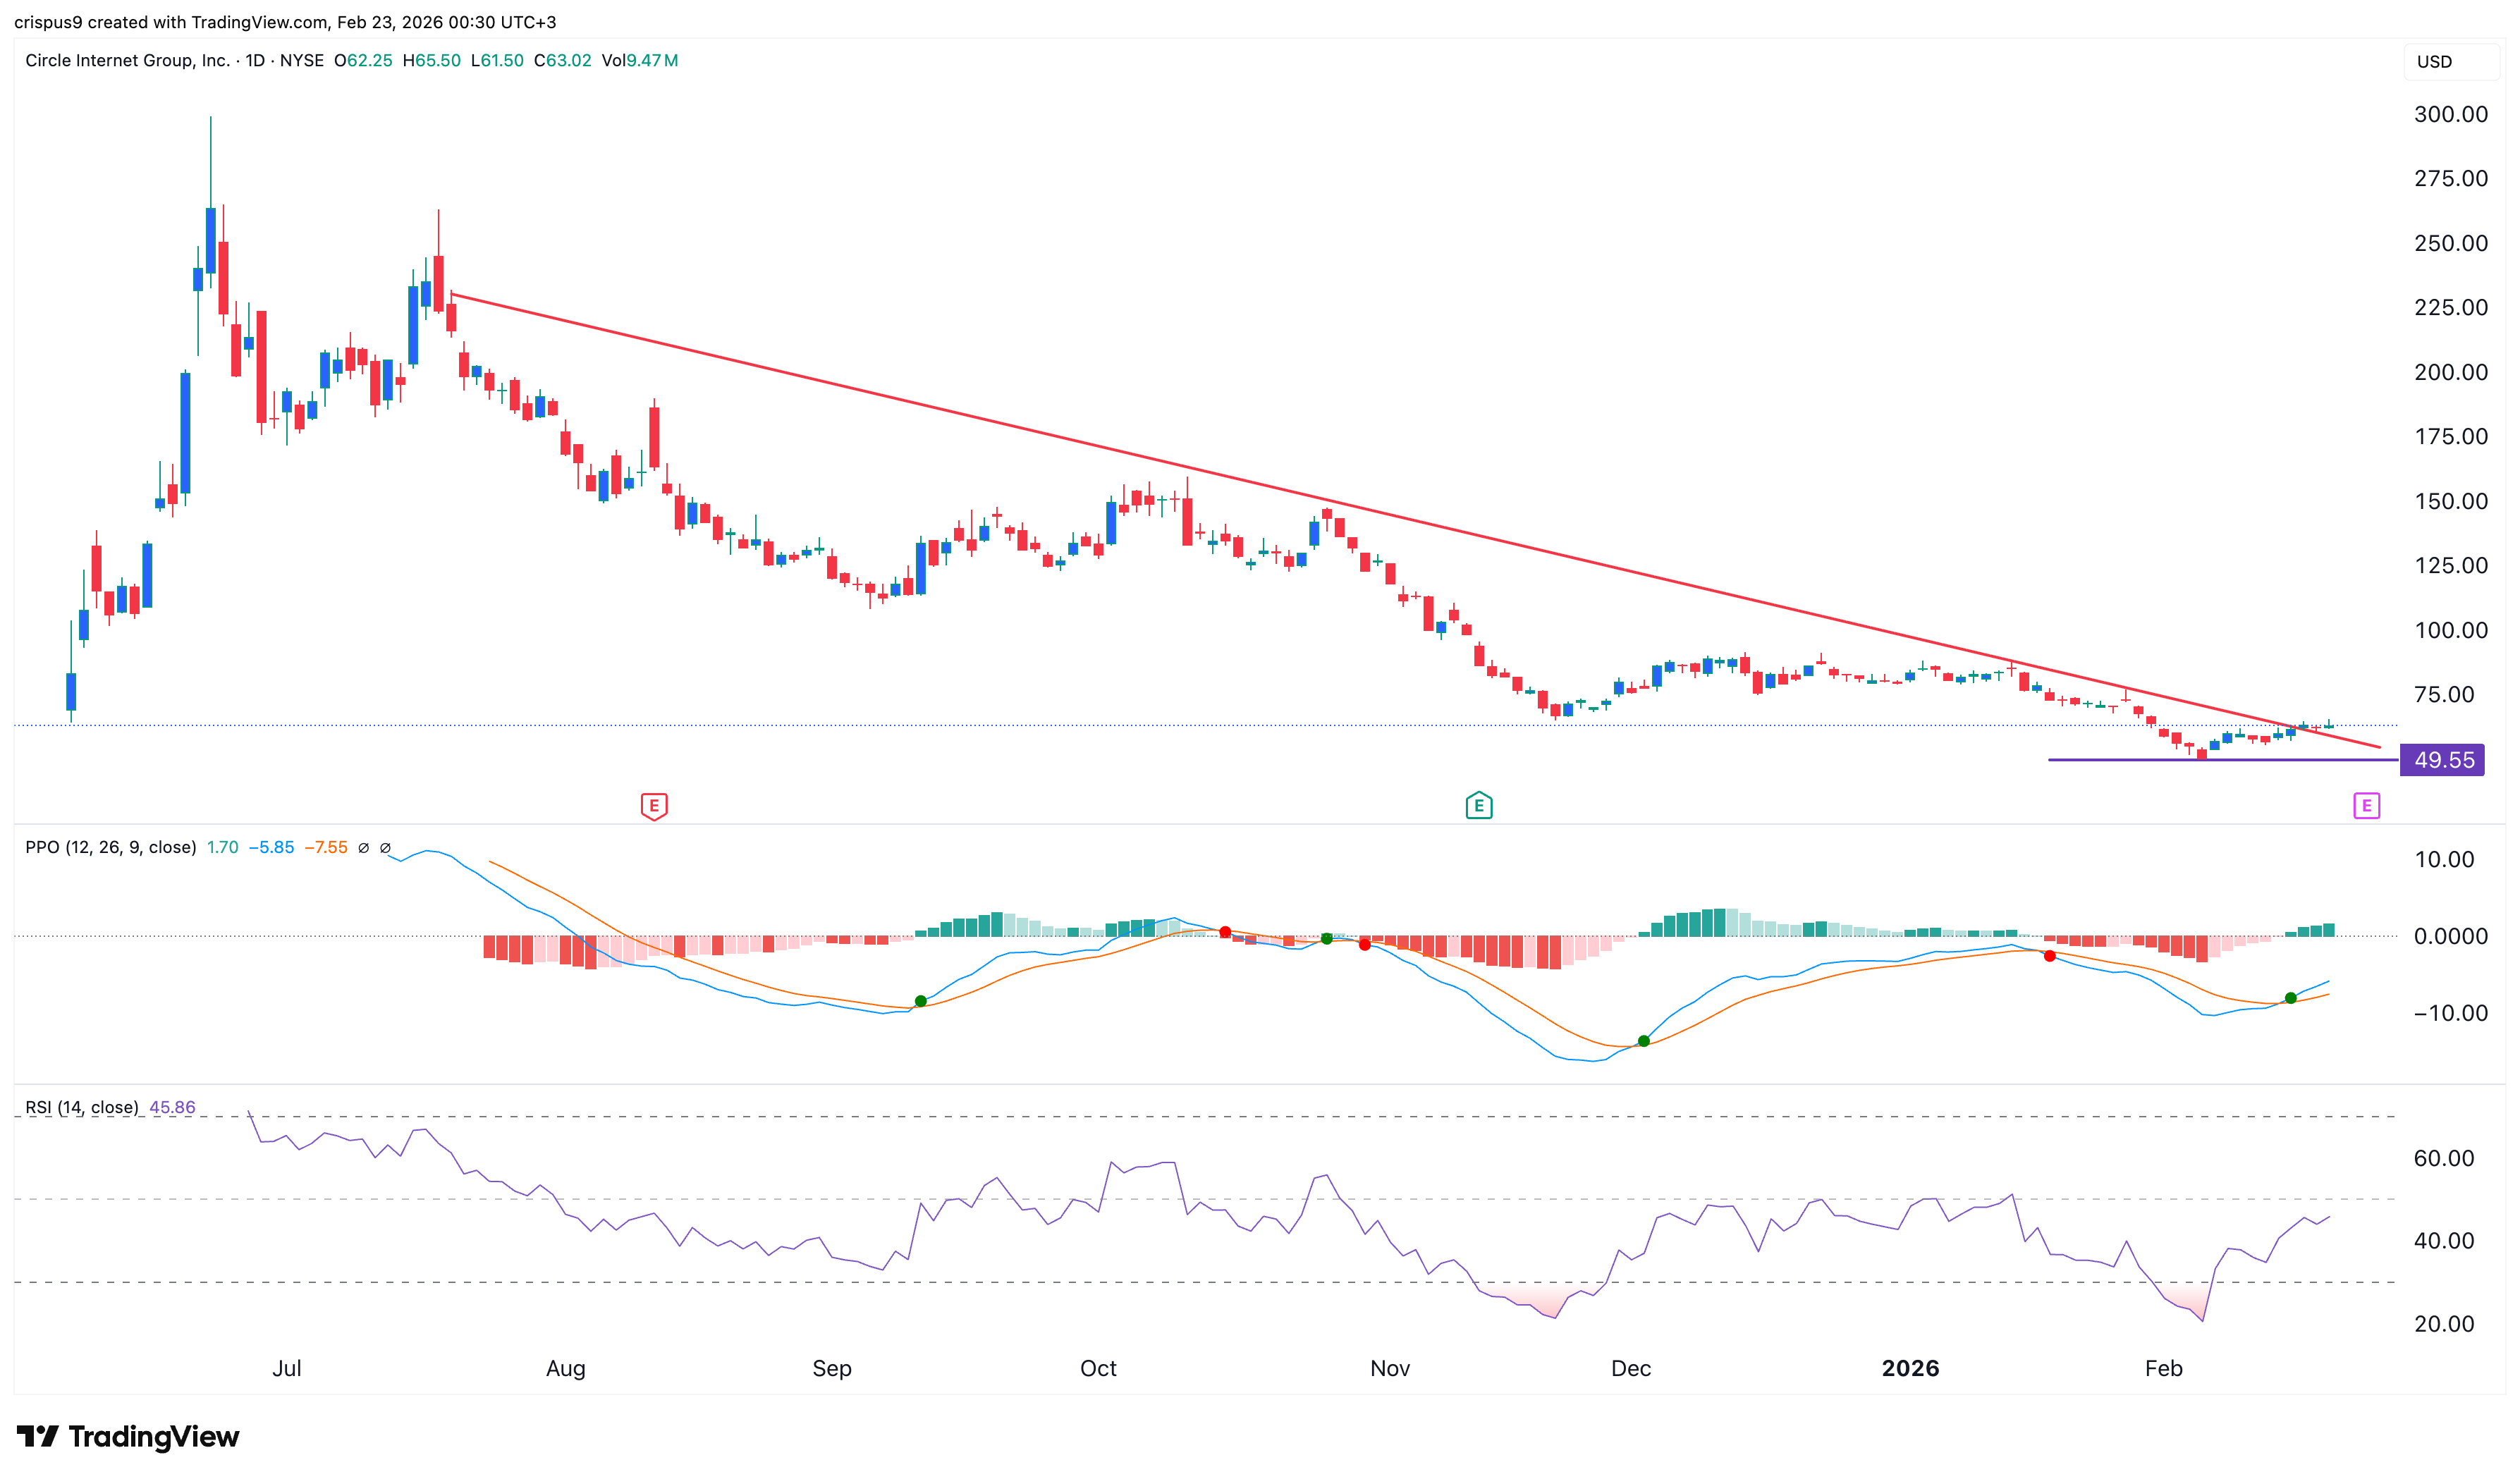
The daily timeframe chart shows that the CRCL stock price has rebounded from a low of $49.5 to its current price of $63. It has formed slightly above the descending trendline, which connects the highest swings since October 10 last year.
The Relative Strength Index (RSI) has moved from the oversold level to the current 38. Also, the two lines of the Percentage Price Oscillator (PPO) have formed a bullish crossover pattern.
Therefore, the most likely scenario is where the stock rises a bit, potentially to $70, and then resumes the downtrend, potentially to the year-to-date low of $49.5.
READ MORE: Bitcoin Price Prediction as Top Republicans Urge Trump to Attack Iran