


- Polkadot token has soared in the past two days, making it one of the top tokens.
- The rebound is part of the ongoing crypto market rally.
- The rally could be a dead cat bounce, where a falling asset rebounds and then dips.
Polkadot crypto price surged this week, making it one of the top-performing coins in the market. On Thursday, the DOT token reached a high of $1.743, up 57% from its lowest point this year. This rally has pushed its market capitalization to over $2.7 billion.
Why Polkadot Crypto Price is Soaring
DOT crypto price went parabolic this week, reaching its highest level in nearly a month. This rebound coincided with the ongoing crypto market rally that is happening across the board.
Bitcoin price moved close to the key resistance level at $70,000 as it staged a strong recovery from this week’s low of $63,000. Historically, crypto prices have often moved in sync with one another.
DOT price rose as the futures open interest rose to its highest level in months. It jumped to $246 million, its highest level since October 10 last year, when the crypto industry suffered a major liquidation event.
READ MORE: BitMine Stock Price Forms Bullish Pattern Pointing to BMNR Rebound
Soaring futures open interest is a sign that a coin’s demand is rising, as a substantial amount of cryptocurrency trading occurs in the futures market today.
Still, the network remains fundamentally under pressure, despite the upgrade to Polkadot 2.0, which introduced smart contracts and other features. Third-party data shows that the network has not gained market share in key industries such as decentralized finance (DeFi), stablecoins, and real-world asset tokenization.
To a large extent, there are signs that major developers have settled on top chains like Solana and Ethereum for their developments, leaving other chains like Polkadot and IOTA behind. For example, data shows that Polkadot has just $87 million in stablecoin supply.
DOT Price Prediction: Technical Analysis
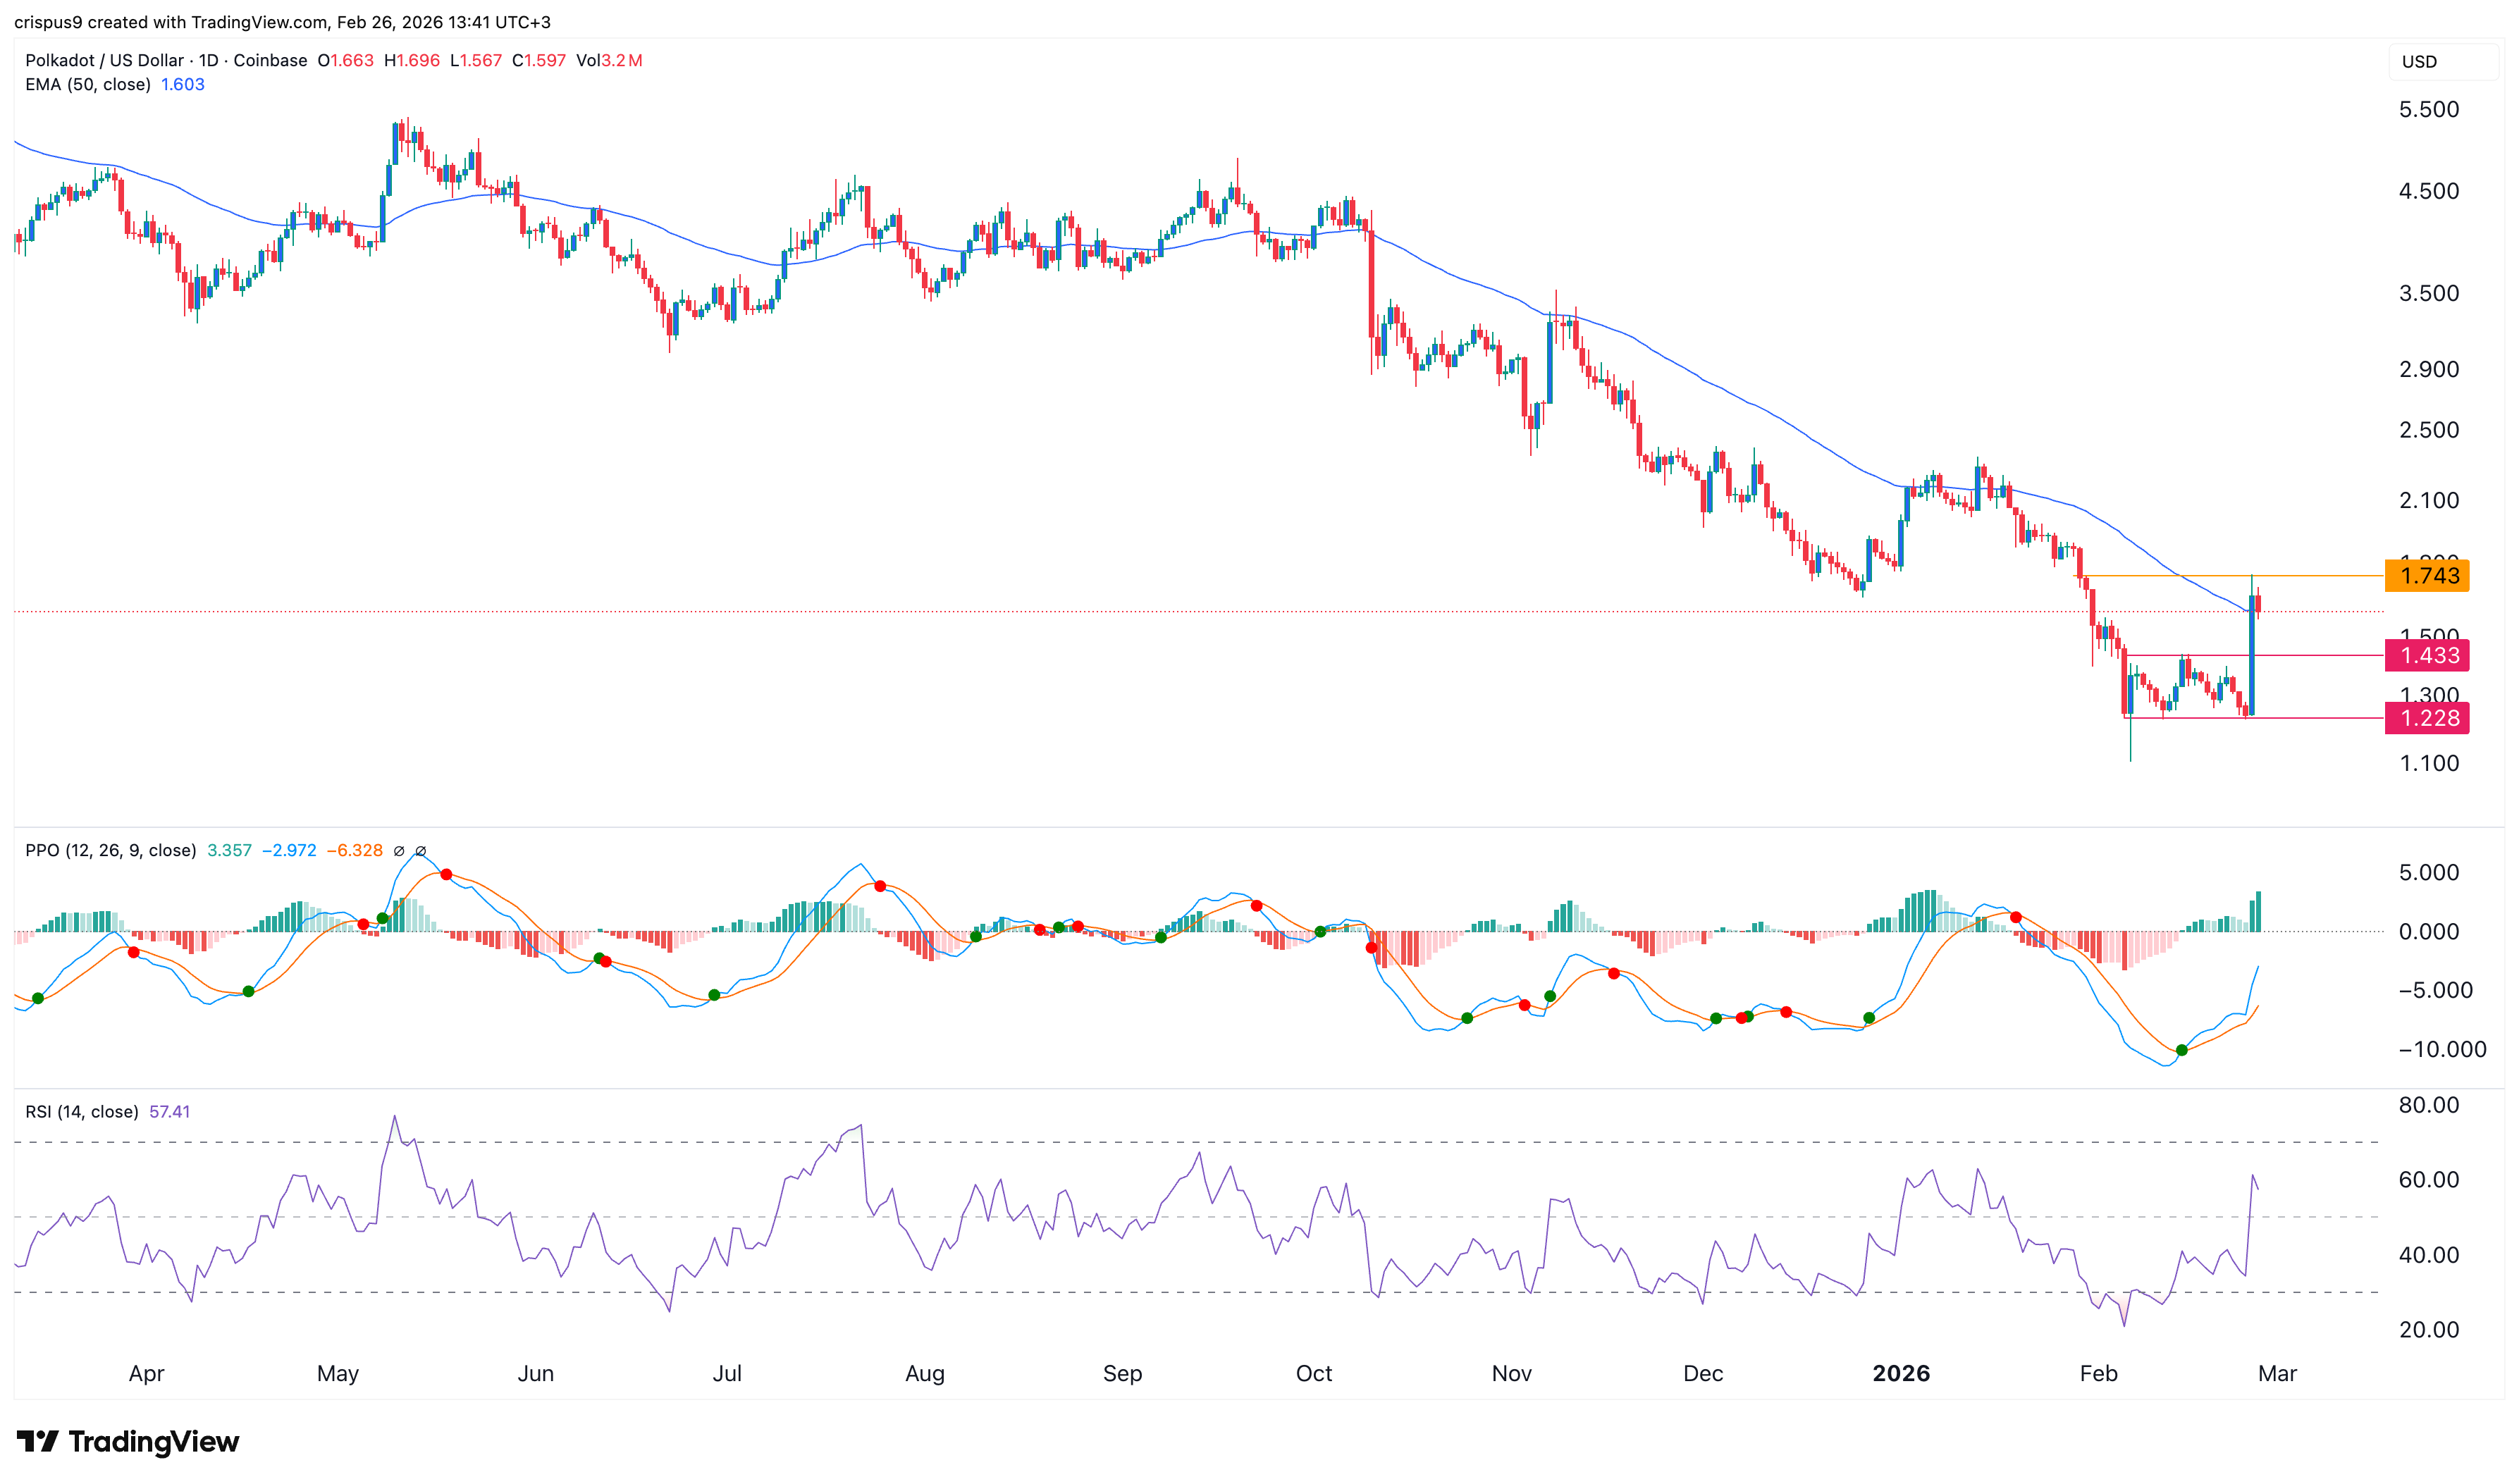
The daily timeframe chart shows that the Polkadot price rebounded after forming a double bottom at $1.228 and a neckline at $1.433, reaching its highest level on February 25. A double-bottom is one of the most common bullish reversal signs in technical analysis.
The coin has moved above the 50-day Exponential Moving Average (EMA), which is a bullish sign. Also, the two lines of the Percentage Price Oscillator (PPO) have formed a bullish crossover pattern. The Relative Strength Index (RSI) has continued rising and is nearing the overbought level of 70.
Therefore, the coin may continue rising in the near term, potentially reaching a high of $2.50, which is about 56% above the current level.
On the other hand, there is a risk that the ongoing recovery is a dead-cat bounce, a situation in which an asset in freefall bounces back briefly before resuming the downtrend.
READ MORE: XRP Price Prediction: Double-Bottom Forms as Key Metrics Jump