


Pi Network price suffered a big reversal on Friday and Saturday, making it the worst-performing top-100 coin. It dropped to $0.2085, down by 30% from its highest point this week. The retreat happened even after it got listed on Kraken on Friday.
Reasons Why Pi Coin is Falling
There are three main reasons why Pi Network price dropped sharply after the Kraken listing. First, as we wrote in this report, the decline is mostly because the Kraken listing was priced in. As a result, the decline is because of a situation known as buying the rumor and selling the news.
It happens when financial assets jump before a major event happens and then drop after it happens. It is also common for an asset to fall before bad news happens and then rise when it occurs.
The same dynamic explains why the coin pulled back on Pi Day. It surged as investors anticipated the commemoration, only to drop once the event passed. Now the question on everyone’s mind is simple: what comes next?
READ MORE: Crypto Rally Today: Why are BTC and Altcoins Rising as the Stock Market Crashes?
Second, Pi Network price is falling as investors book profits as it was one of the best-performing coins this week. At its peak on Friday, it was up by 126% from its lowest level in February this year, beating popular tokens like Bitcoin and Solana.
Third, the coin had a weak reception on Kraken. Data compiled by CoinGecko shows that the volume on the platform was just $451,722. In contrast, the total volume in exchanges rose to $155 million in the last 24 hours.
Pi Network Price Prediction: Technical Analysis
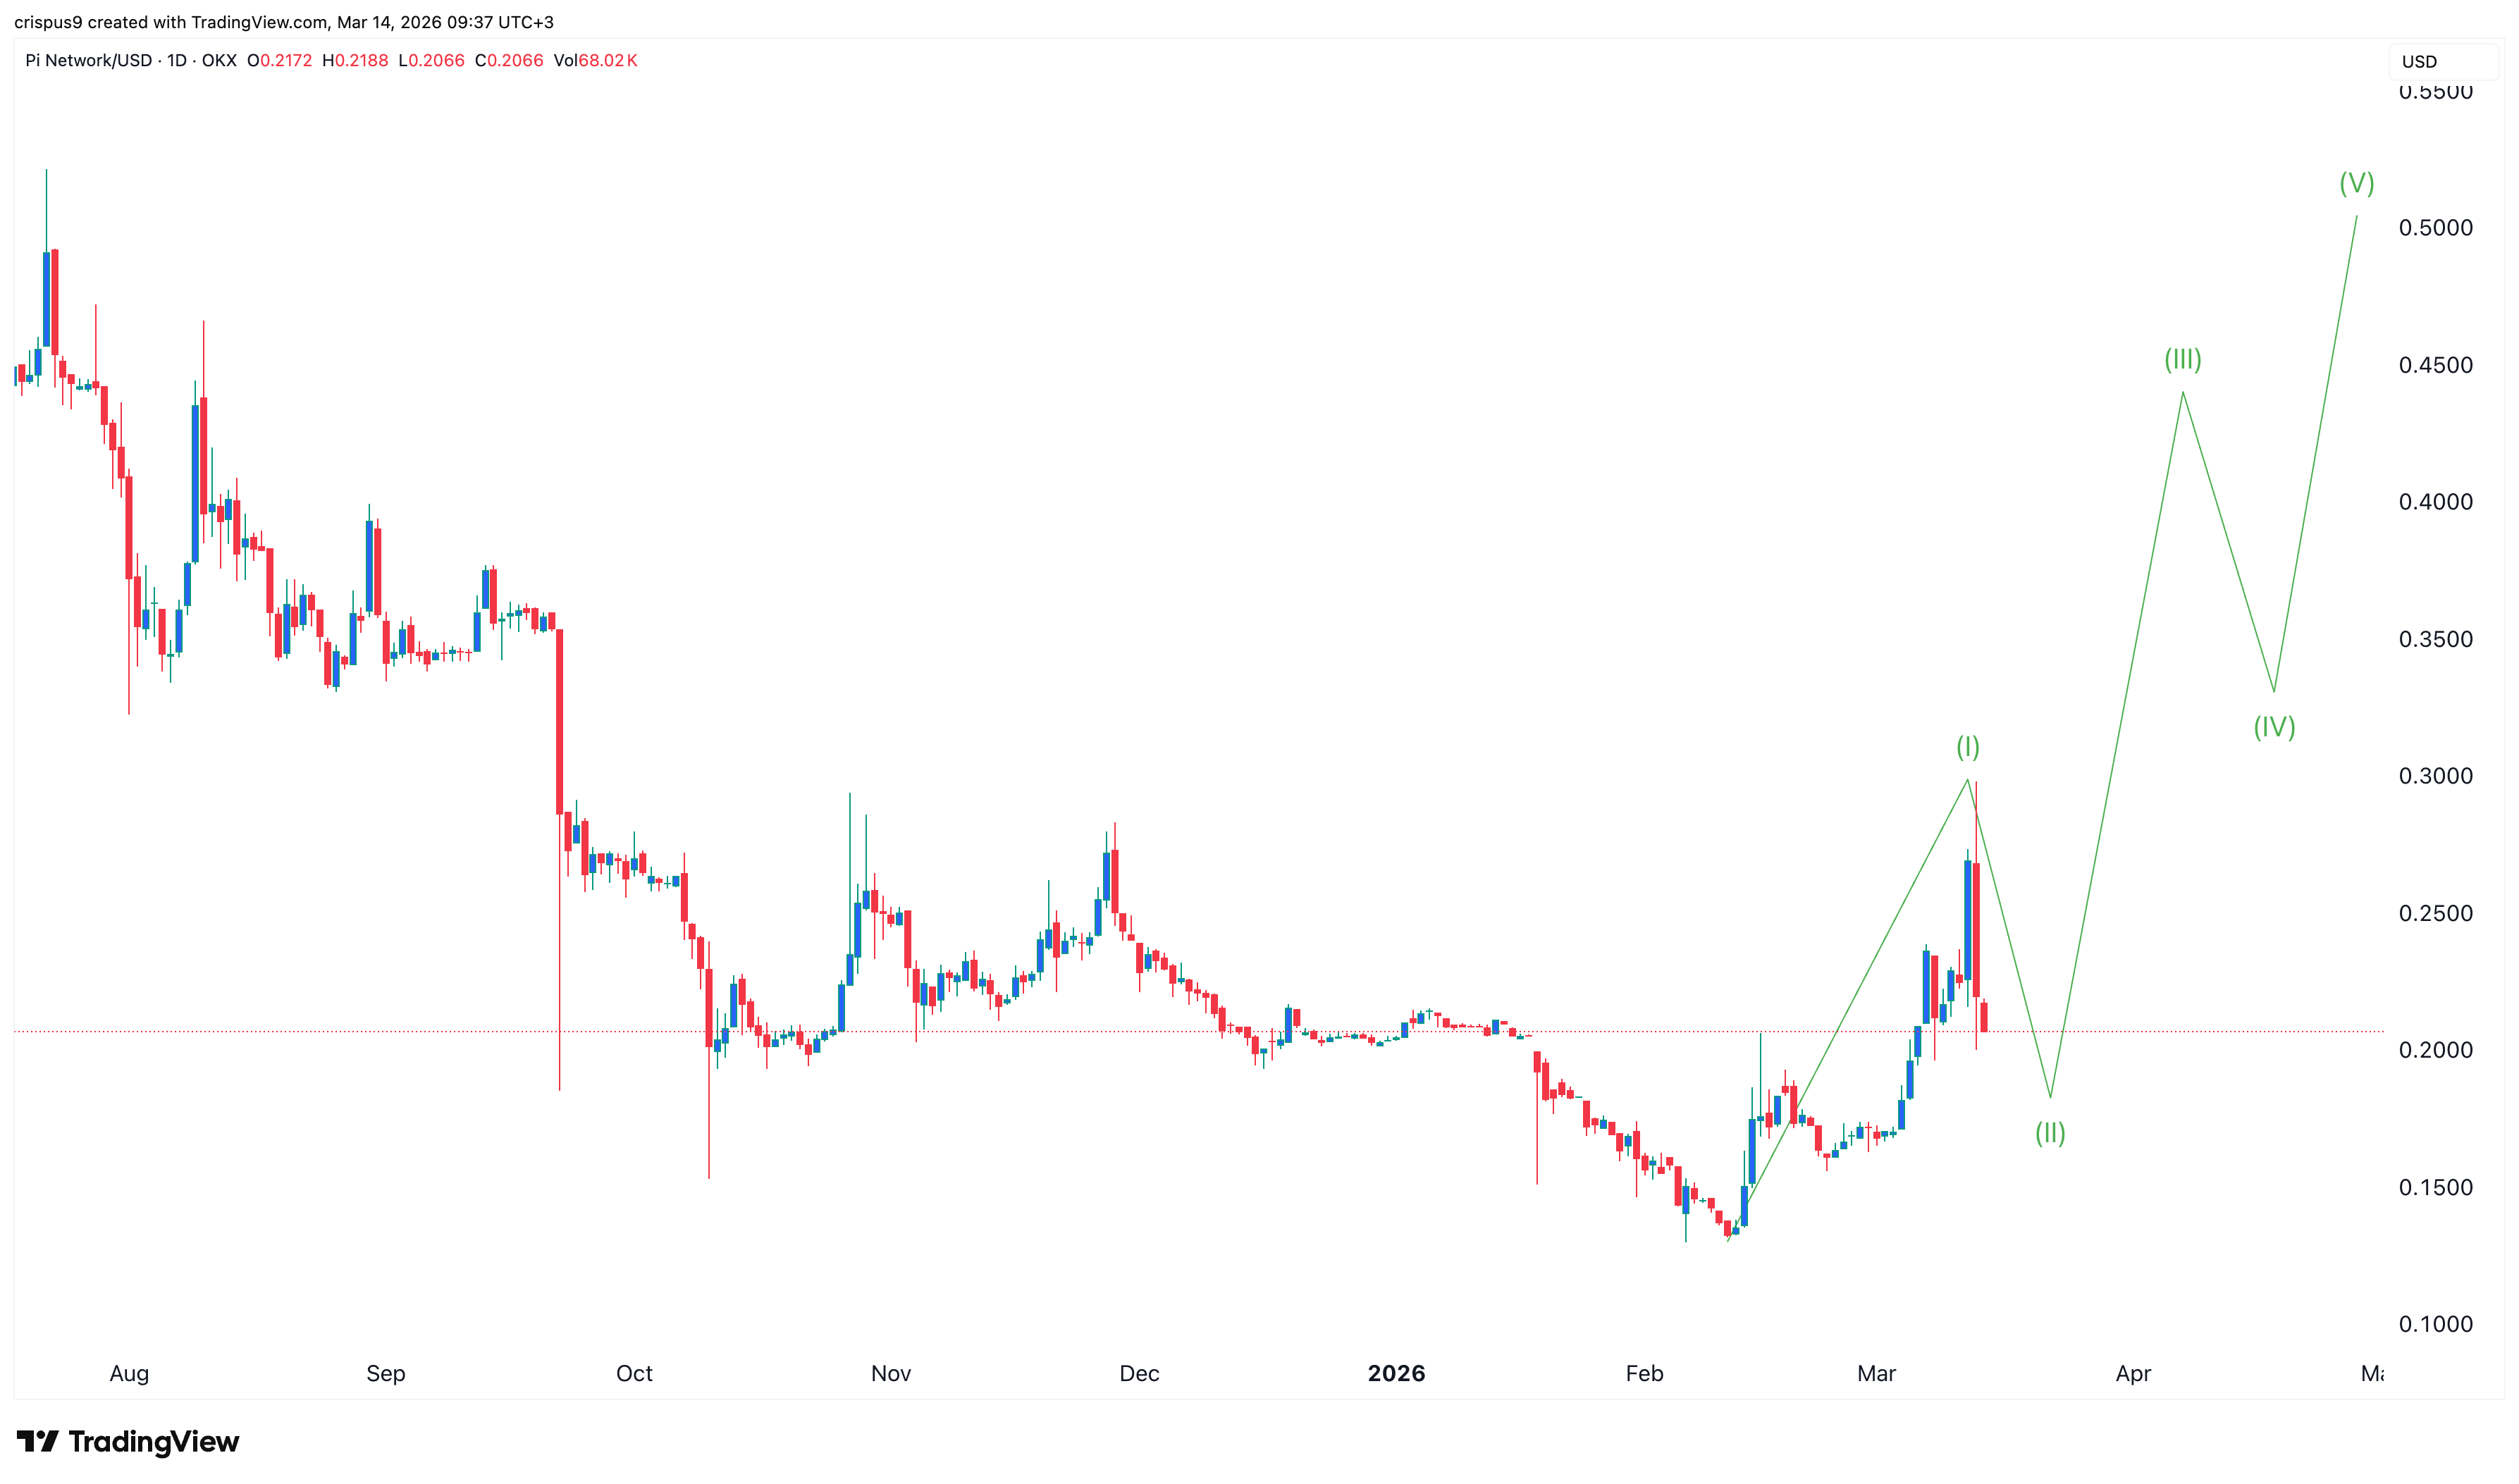
Pi Coin price chart | Source: TradingView
The daily timeframe chart shows that the Pi Coin price surged to a multi-month high of $0.300, as we predicted here. It then suffered a big reversal, also as we predicted.
A closer look shows that it has formed a bearish engulfing pattern, which happens when a big bearish candle follows a smaller bullish one. This pattern often leads to a bearish breakout.
On the positive side, there are signs that the coin has moved to the second phase of the Elliot Wave pattern, meaning that the bullish third phase may follow next. If this happens, the next key target to watch will be this week’s high of $0.300, followed by the psychological level at $0.50.
READ MORE: CoreWeave stock: CRWV Forms Risky Patterns as Short Interest and CapEx Jump