


- Bitcoin price has remained above the crucial support level at $70,000.
- Top senators and the White House reached an important deal on the CLARITY Act.
- The coin has formed an inverted head-and-shoulders pattern pointing to a rebound.
Bitcoin price held relatively steady above the key support level at $70,000, continuing to outperform other assets like gold and the stock market. BTC was trading at $70,630, up by nearly 20% from its lowest level this year.
Its recovery may continue after forming the highly bullish inverted head-and-shoulders pattern and after the rising signs that the CLARITY Act will be signed into law soon. However, a top analyst from Galaxy warns that the bill still faces some major challenges.
Bitcoin Price Could Rebound After CLARITY Act Progress
BTC price has some major catalysts that may boost its performance in the coming weeks. The most important one is that the Senate may finally pass the CLARITY Act after key leaders reached a deal with the White House on stablecoin yield.
The deal was reached between Senator Thom Tillis, Angela Alsobrooks and White House officials. Details of the compromise have not been made public, but analysts believe that it may pass in the coming weeks or months.
The main issue has been whether cryptocurrency exchanges like Coinbase and Kraken should be able to pay interest on stablecoins held in their platforms.
READ MORE: PayPal Stock On The Verge of a Crash Despite Robust PYUSD Growth
Banks are opposed to these returns as such a move will siphon cash from their institutions into crypto exchanges. As a result, they argue that such a move will reduce the money that they use to lend to customers, affecting the economy.
The CLARITY Act will be the second most important policy to pass in Congress after the GENIUS Act, which focused solely on stablecoins.
Still, in a statement, Alex Thorn, a senior official at Galaxy Digital, there are more hurdles that may prevent the bill from passing in Congress this year.
Bitcoin has more tailwinds ahead, including the ongoing rotation from gold. While the GLD ETF has shed assets in the last three weeks, Bitcoin ETFs have added over $1.5 billion in the same period.
Bitcoin Price Prediction: Technical Analysis
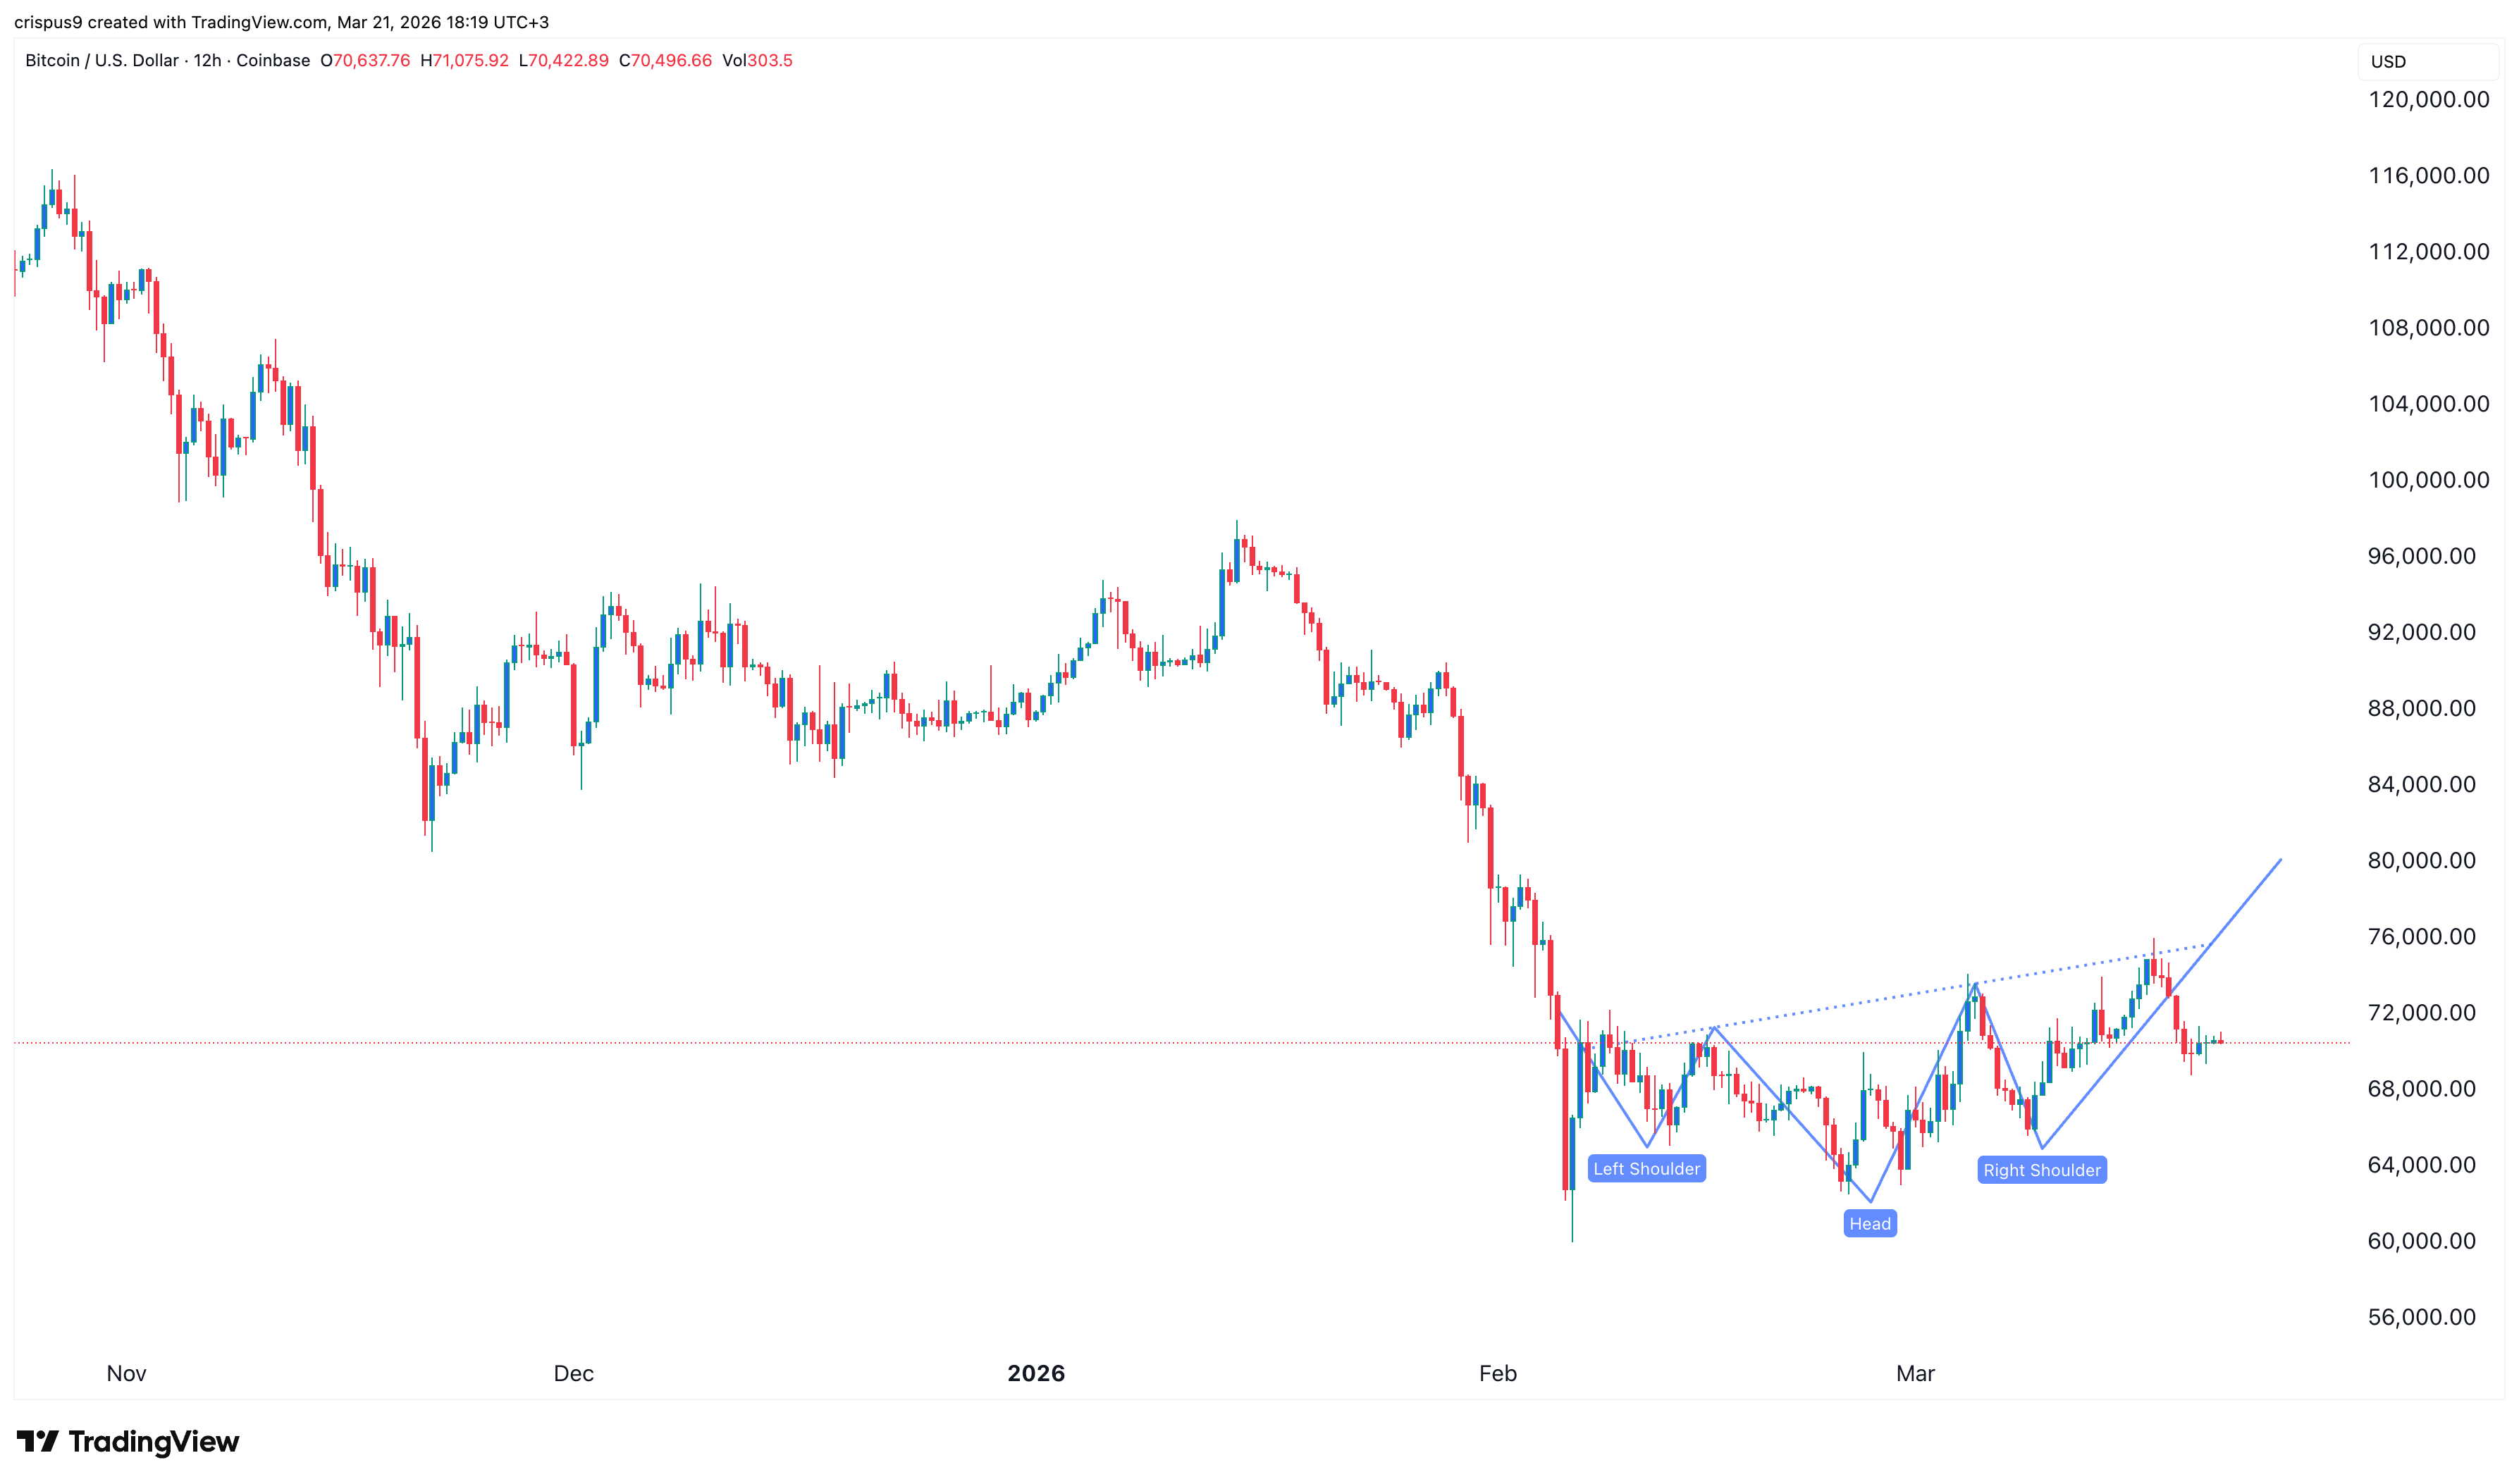
The 12-hour timeframe chart shows that the BTC price has pulled back in the past few days. Despite this, it has remained above the important support level at $70,000.
Fortunately, it is in the process of forming the popular inverted head-and-shoulders pattern, which often leads to a strong bullish breakout. It is hovering near the neckline of this pattern.
Therefore, the coin will likely have a strong bullish breakout in the coming days or weeks, potentially to the key resistance level at $80,000. A move above that price will likely lead to a crypto bull run, which may push it to the resistance level at $100,000.
READ MORE: Silver Price Forecast as the Crash and SLV ETF Outflows Gain Steam