


- Gold price has tumbled in the last eight consecutive days.
- The GLD ETF has suffered substantial outflows in the past three weeks.
- Technical analysis suggests that gold will continue falling in the near term.
Gold price continued its strong freefall as investors continued to dump their holdings of the SPDR Gold ETF (GLD). It dropped to $4,497, its lowest level since February 2nd, and 20% from its highest point this year.
SPDR Gold ETF Outflows Jump
Gold price is in a strong freefall this month, erasing some of the gains made earlier this year when it jumped to a record high of $5,600. This crash is happening despite the ongoing Iran war that has pushed energy prices to the highest level in months.
Gold is likely falling as investors sell the news. In this case, the metal jumped to a record high as odds that President Donald Trump and Benjamin Netanyahu would attack Iran jumped on Polymarket, Kalshi, and other prediction markets. These soaring odds pushed investors to safe havens, of which gold is widely seen as the most popular ones.
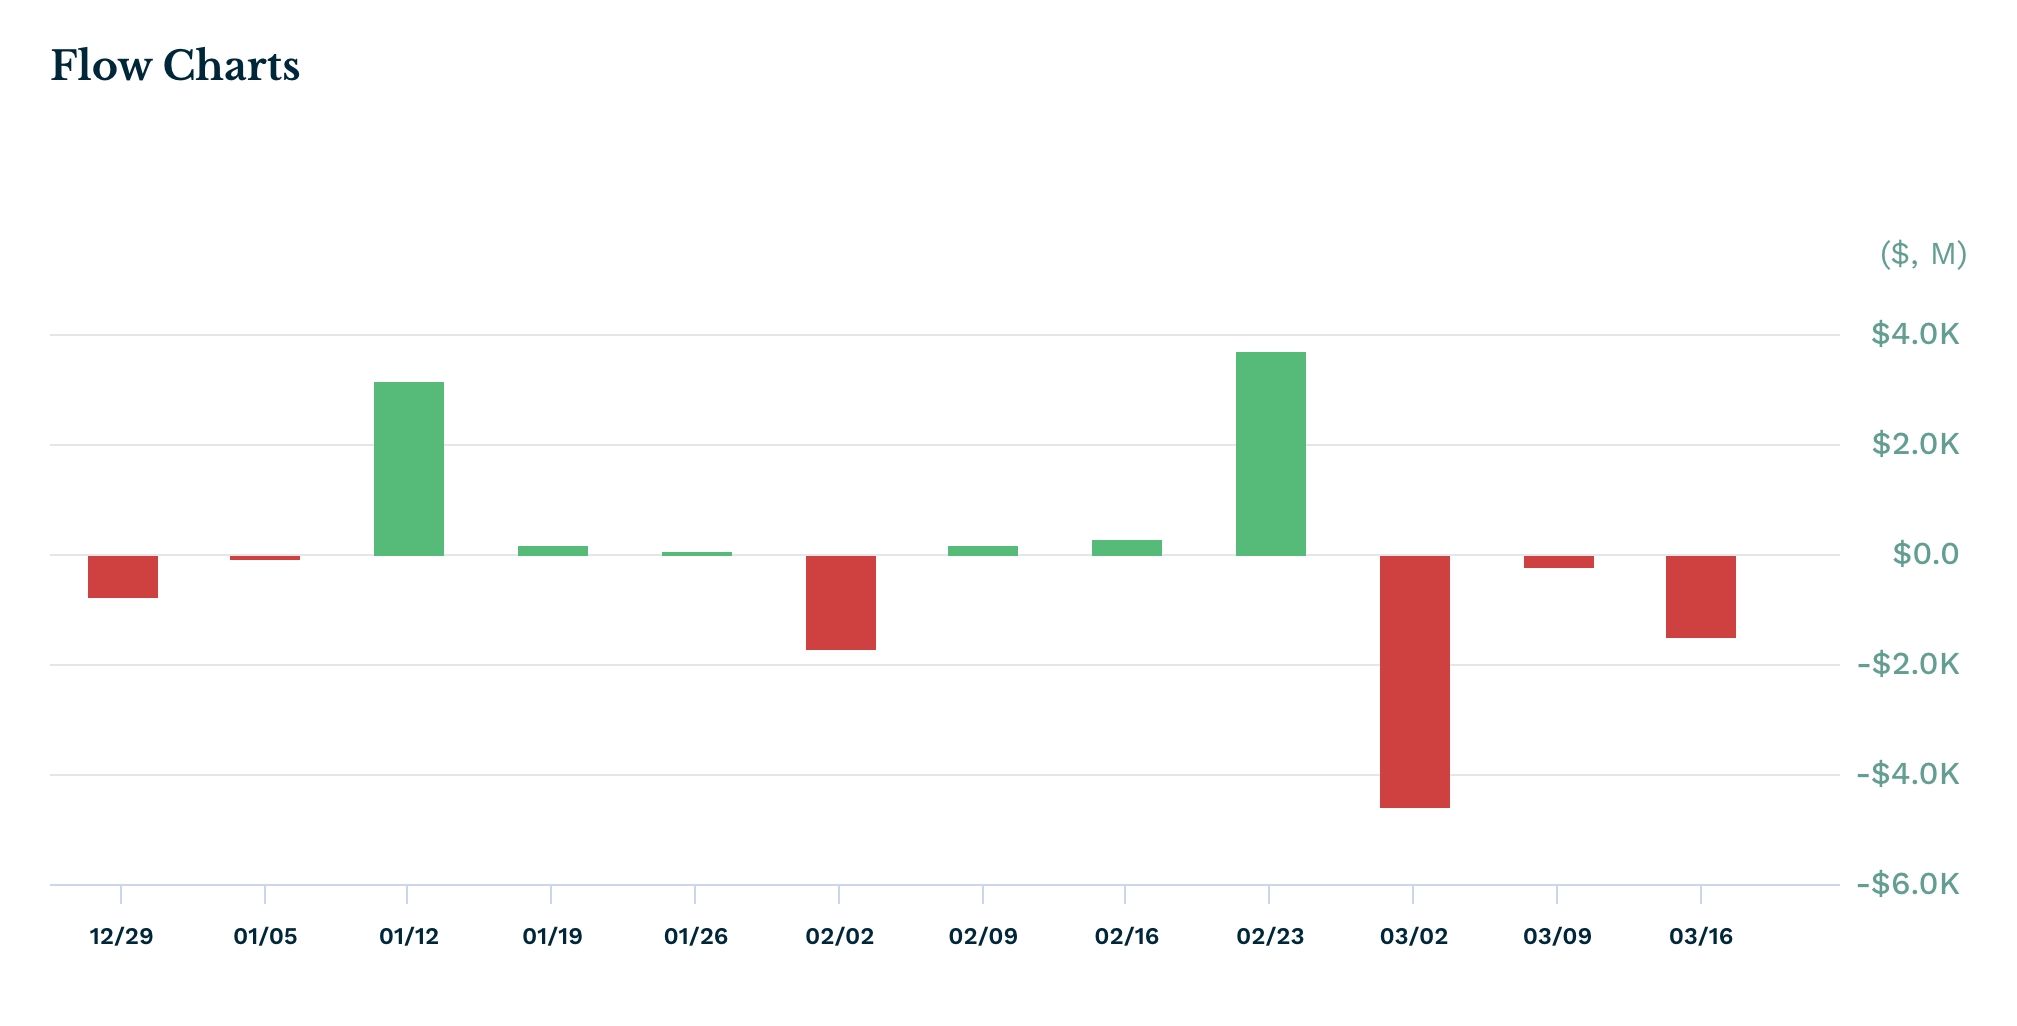
Therefore, the ongoing gold price crash is happening as investors sell the news as the war was in line with expectations. Indeed, data shows that the popular SPDR Gold ETF (GLD) has shed assets in the last three consecutive weeks, and the outflows are rising. It shed over $1.5 billion in assets this week after losing $232 million a week earlier. It has lost over $6 billion in the last three weeks.
READ MORE: PayPal Stock On The Verge of a Crash Despite Robust PYUSD Growth
In contrast, there are signs that investors are rotating to Bitcoin, whose ETFs have added over $1.5 billion this year. Bitcoin has also held relatively steady in the same period.
The gold price has also slipped as Donald Trump hinted that he was about to wind down the war now that the US has attacked most of the planned targets.
While this is good news, there are concerns that Israel has not yet finished its objectives, including that of regime change. Also, Iran has prepared for a long war as it seeks more concessions.
Gold price also crashed as the Federal Reserve maintained a hawkish tone, with some analysts expecting that it will hike rates this year as inflation remains stubbornly high.
Gold Price Technical Analysis
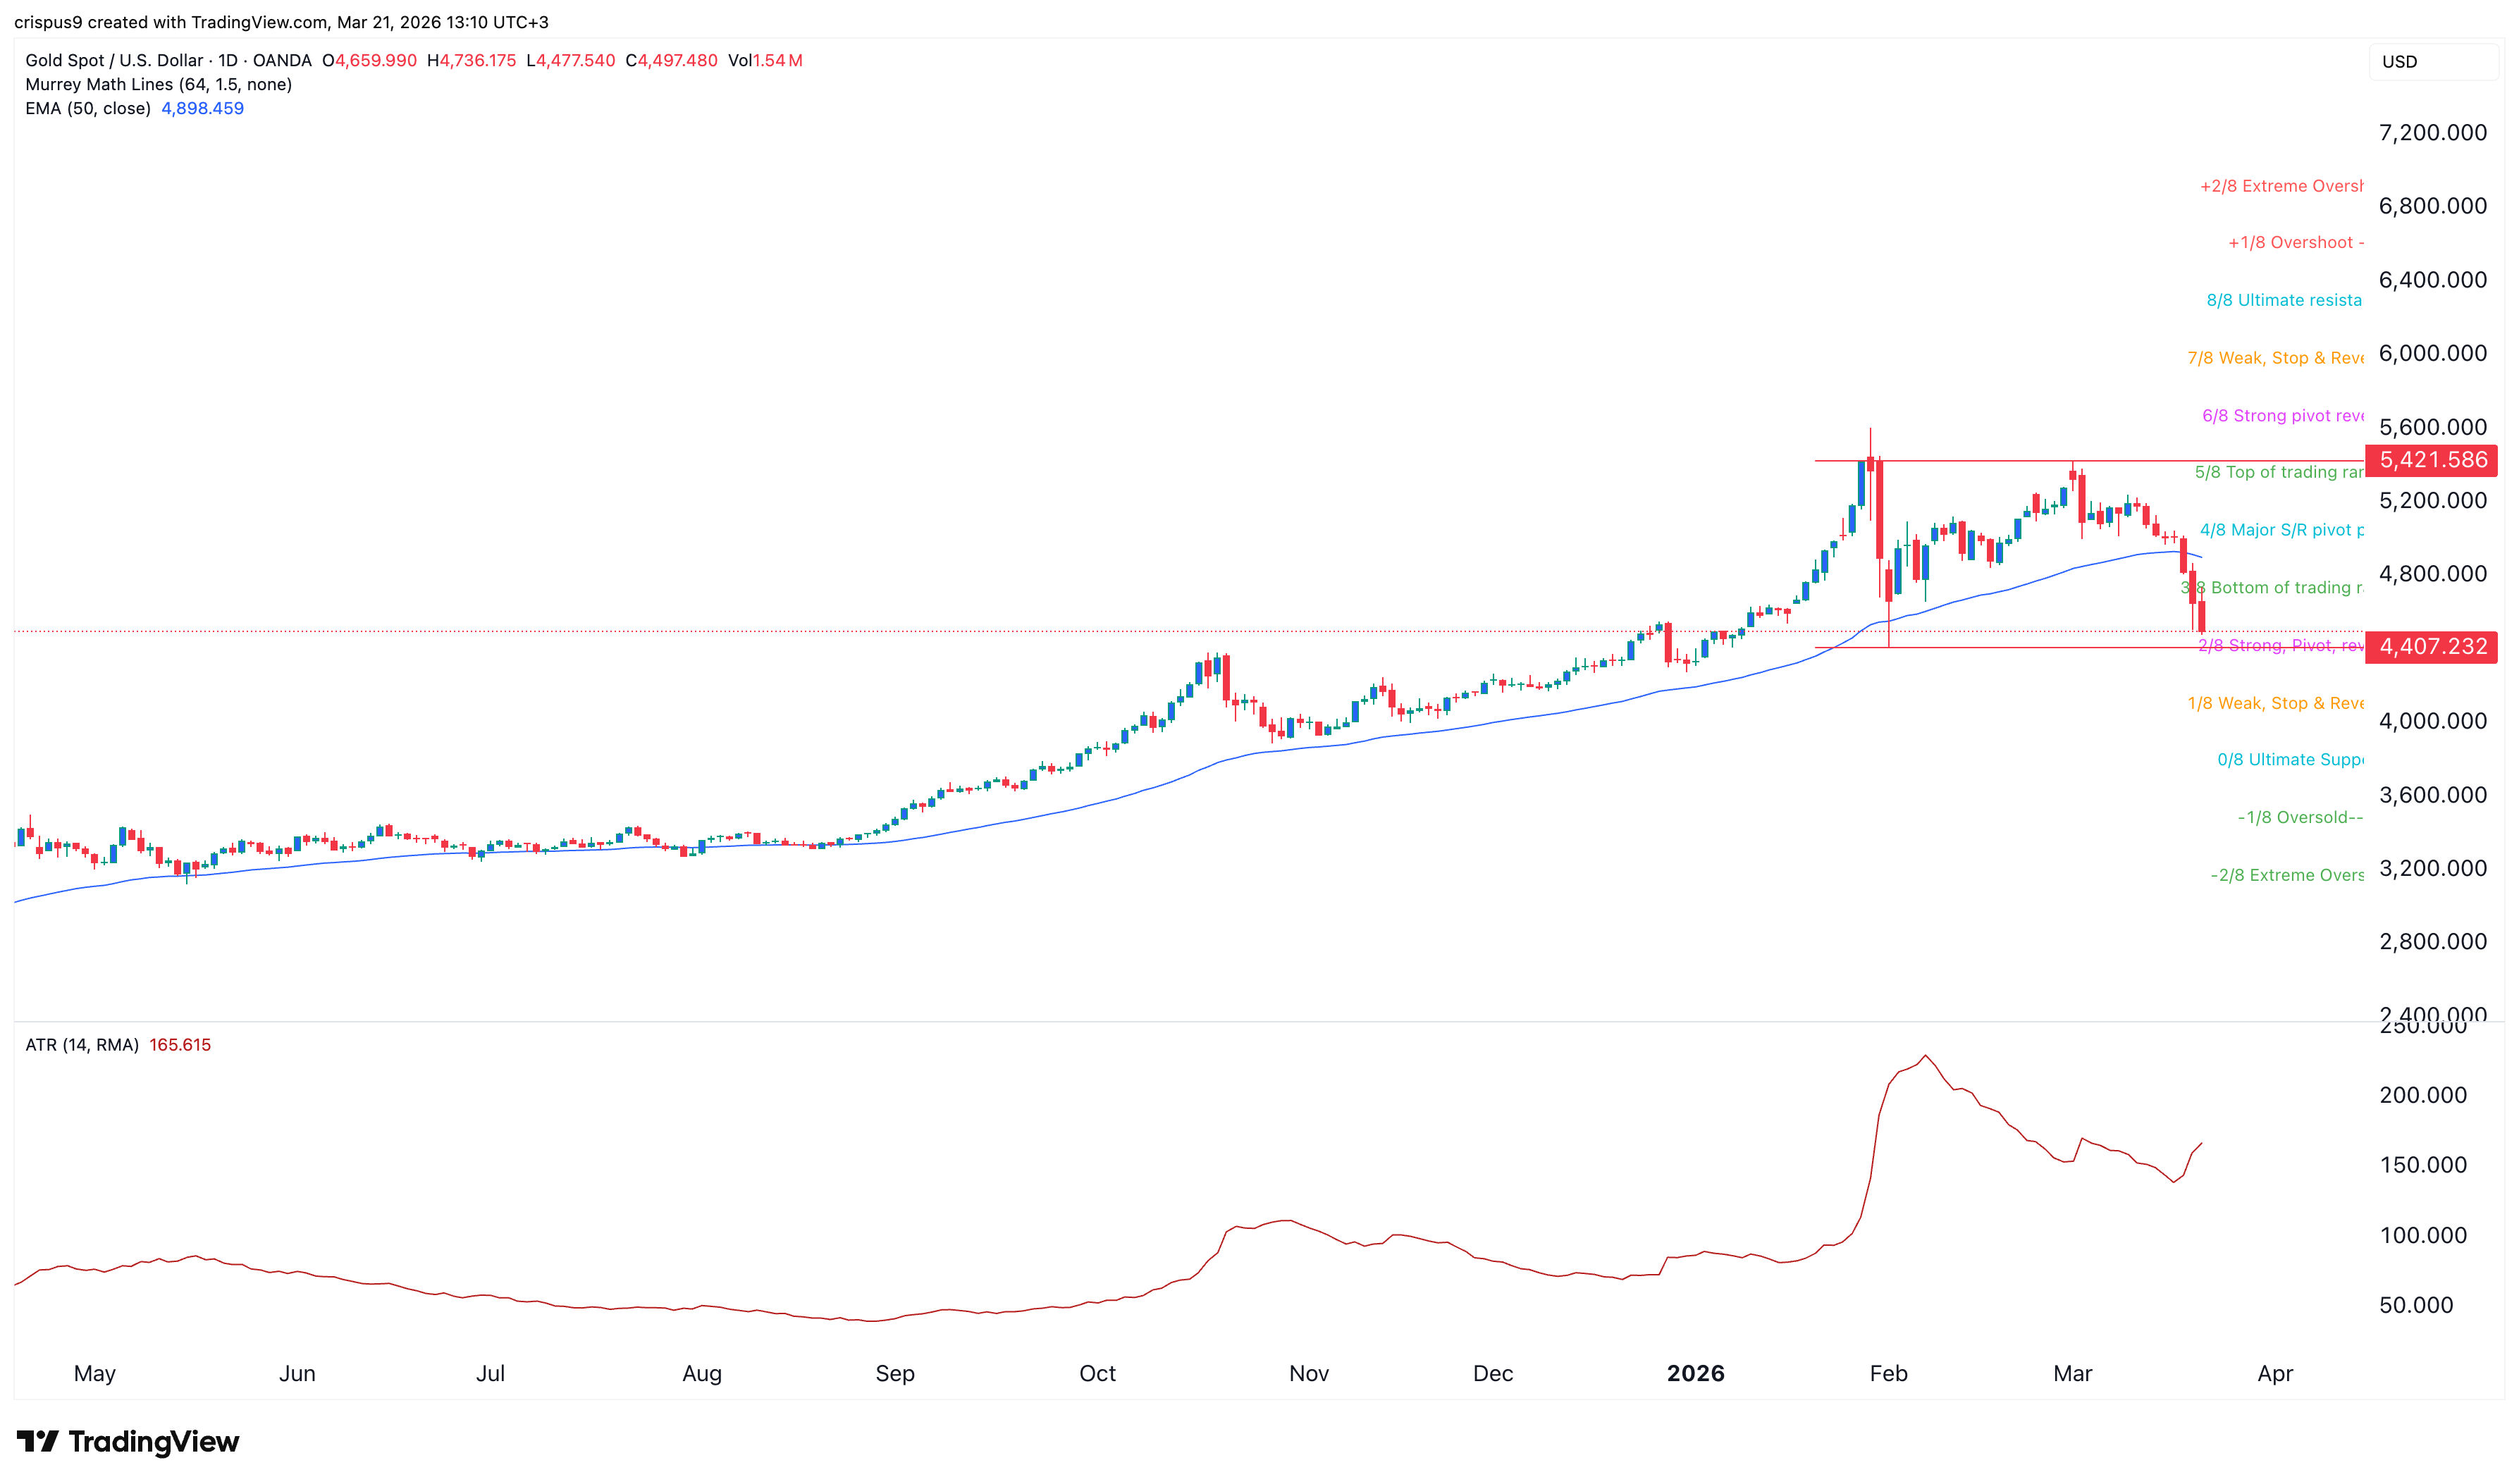
The daily timeframe chart shows that the gold price has slumped in the past few days and is now trading at its lowest level since February 2nd. It formed a double-top pattern at $5,420 and a neckline at $4,400. A double top is one of the most common bearish reversal patterns in technical analysis.
Gold has dropped below the Major S&R pivot point of the Murrey Math Lines and the 50-day Exponential Moving Average, while the Average Directional Index (ADX) has jumped, a sign that the downtrend is gaining momentum.
Therefore, the most likely gold price forecast is bearish, with the next key target being at $4,407, its lowest level in February. A drop below that level will signal more downside, potentially to the psychological level at $4,000.
READ MORE: Pi Network Coin Rally: Why a 70% Price Surge Looks Likely